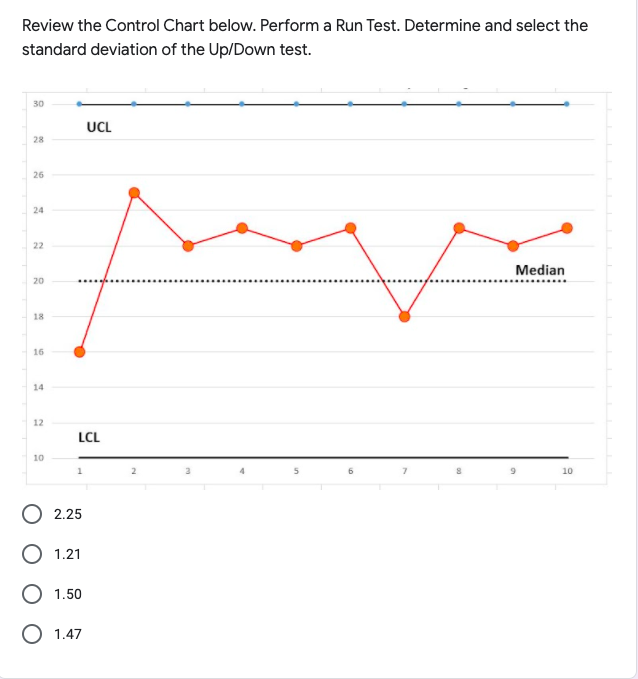
Question: Review the Control Chart below. Perform a Run Test. Determine and select the standard deviation of the Up/Down test. 30 UCL 28 26 24 22

Review the Control Chart below. Perform a RunReview the Control Chart below. Perform a RunReview the Control Chart below. Perform a Run

Review the Control Chart below. Perform a Run Test. Determine and select the standard deviation of the Up/Down test. 30 UCL 28 26 24 22 Median 20 18 16 14 12 LCL 10 1 6 7 S 9 10 0 2.25 O 1.21 O 1.50 O 1.47 [4 points] Review the Control Chart below. Perform a Run Test. If your organization's quality standard for a Run Test is z=plus/minus 2, given the results of your Run test, select the most appropriate conclusion given the options below: 30 UCL 28 26 24 22 A Median 20 18 16 14 12 LCL 10 10 The process is in control The process is in control and does not exhibit any non-random variation The process is non-random O The process is in control and exhibits non-random variation Review the Control Chart below. Perform a Run Test. Determine and select the standard deviation of the Above/Below test. 30 UCL 28 26 24 22 Median 20 18 16 14 12 LCL 10 1 5 7 9 10 1.21 1.50 O 1.47 2.25

Step by Step Solution

There are 3 Steps involved in it

1 Expert Approved Answer
Step: 1 Unlock blur-text-image
Question Has Been Solved by an Expert!

Get step-by-step solutions from verified subject matter experts

Step: 2 Unlock
Step: 3 Unlock

Students Have Also Explored These Related General Management Questions!