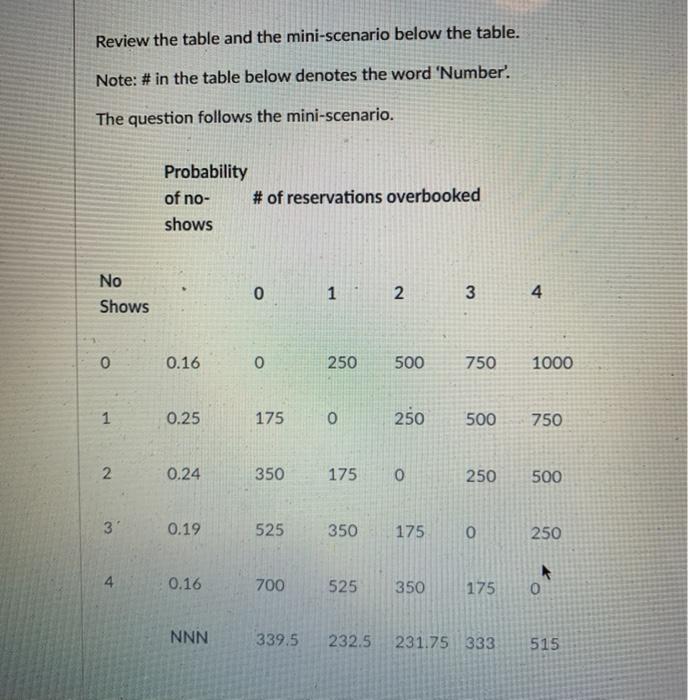
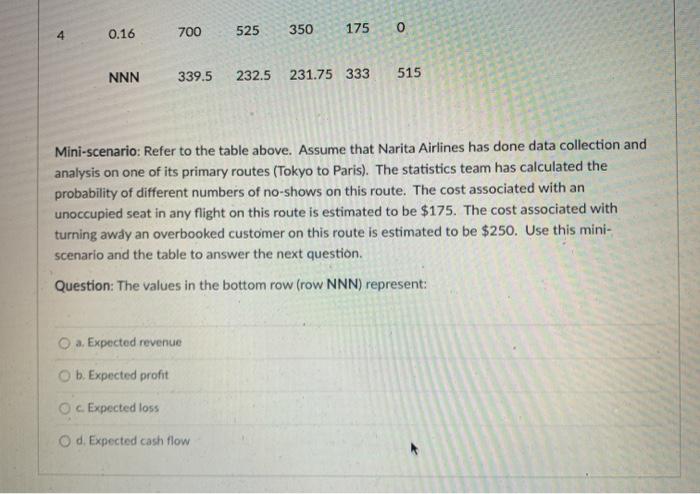
Question: Review the table and the mini-scenario below the table. Note: # in the table below denotes the word 'Number'. The question follows the mini-scenario. Probability

Review the table and the mini-scenario below the
Review the table and the mini-scenario below the table. Note: # in the table below denotes the word 'Number'. The question follows the mini-scenario. Probability of no- # of reservations overbooked shows No Shows 0 12 3 4 o 0.16 0 250 500 750 1000 1 0.25 175 0 250 500 750 N 0.24 350 175 0 250 500 3 0.19 525 350 175 0 250 4 0.16 700 525 350 175 0 NNN 339.5 232.5 231.75 33 515 4 0.16 0 700 525 350 175 NNN 339.5 232.5 231.75 333 515 Mini-scenario: Refer to the table above. Assume that Narita Airlines has done data collection and analysis on one of its primary routes (Tokyo to Paris). The statistics team has calculated the probability of different numbers of no-shows on this route. The cost associated with an unoccupied seat in any flight on this route is estimated to be $175. The cost associated with turning away an overbooked customer on this route is estimated to be $250. Use this mini- scenario and the table to answer the next question Question: The values in the bottom row (row NNN) represent: a. Expected revenue O b. Expected profit c. Expected loss O d. Expected cash flow

Step by Step Solution

There are 3 Steps involved in it

1 Expert Approved Answer
Step: 1 Unlock blur-text-image
Question Has Been Solved by an Expert!

Get step-by-step solutions from verified subject matter experts

Step: 2 Unlock
Step: 3 Unlock

Students Have Also Explored These Related General Management Questions!