

Question: Review the Table, which is the Cronbachs Alpha output for Perceived Quality. What is the Cronbachs Alpha for the Perceived Quality scale? What can you
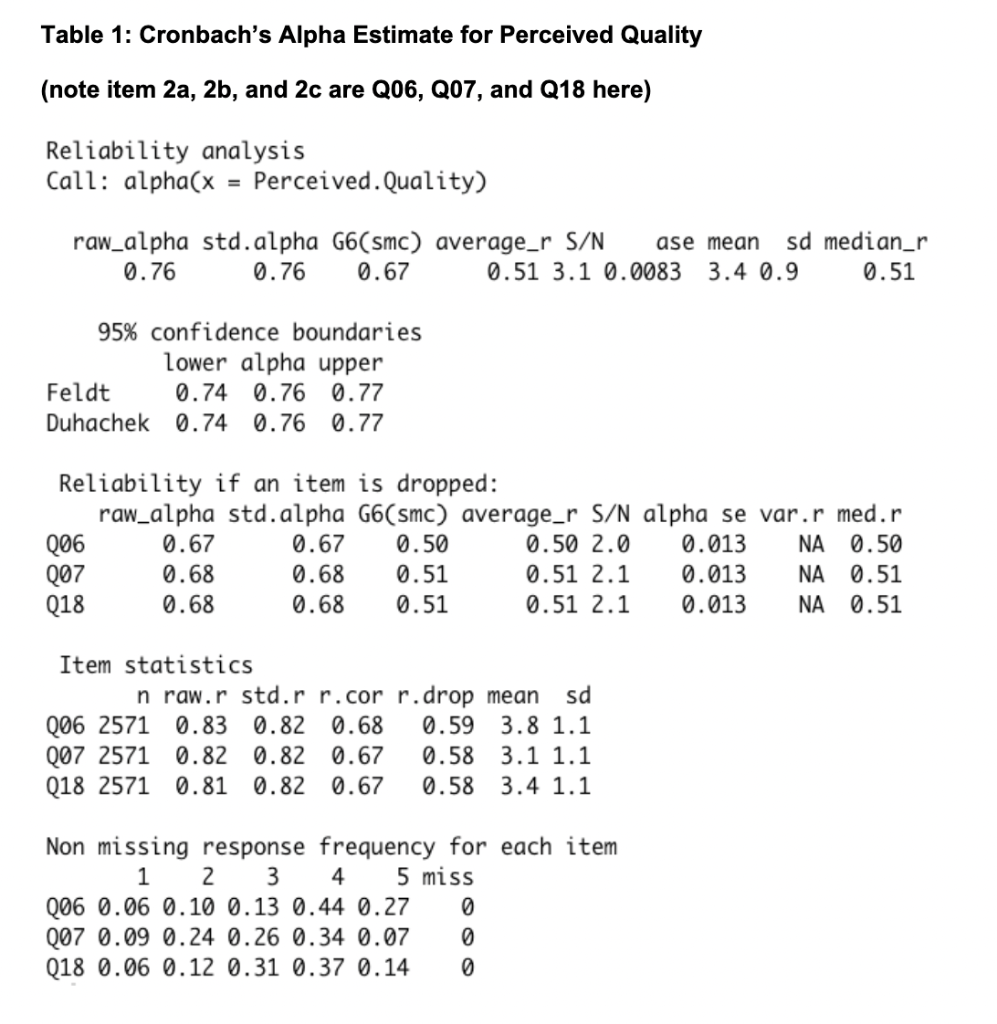
Review the Table, which is the Cronbachs Alpha output for Perceived Quality. What is the Cronbachs Alpha for the Perceived Quality scale? What can you say about the reliability of the scale for Perceived Quality?
Please explain how you know which numbers to use. Thank you!
Table 1: Cronbach's Alpha Estimate for Perceived Quality (note item 2a, 2b, and 2c are Q06, Q07, and Q18 here) Reliability analysis Call: alpha (x= Perceived.Quality ) raw_alpha std.alpha G6(smc) average_r S/N ase mean sd median_r 95\% confidence boundaries lower alpha upper Feldt 0.740.760.77 Duhachek 0.740.760.77 Reliability if an item is dropped: raw_alpha std.alpha G6(smc) average_r S/N alpha se var.r med.r Non missing response frequency for each item Q06Q07Q1810.060.090.0620.100.240.1230.130.260.3140.440.340.3750.270.070.14miss000
Step by Step Solution
There are 3 Steps involved in it

Get step-by-step solutions from verified subject matter experts