

Question: Review the two graphs below: (Click the icon to view the graphs.) Requirement ns 1. From the two graphs given, construct two graphs that depict
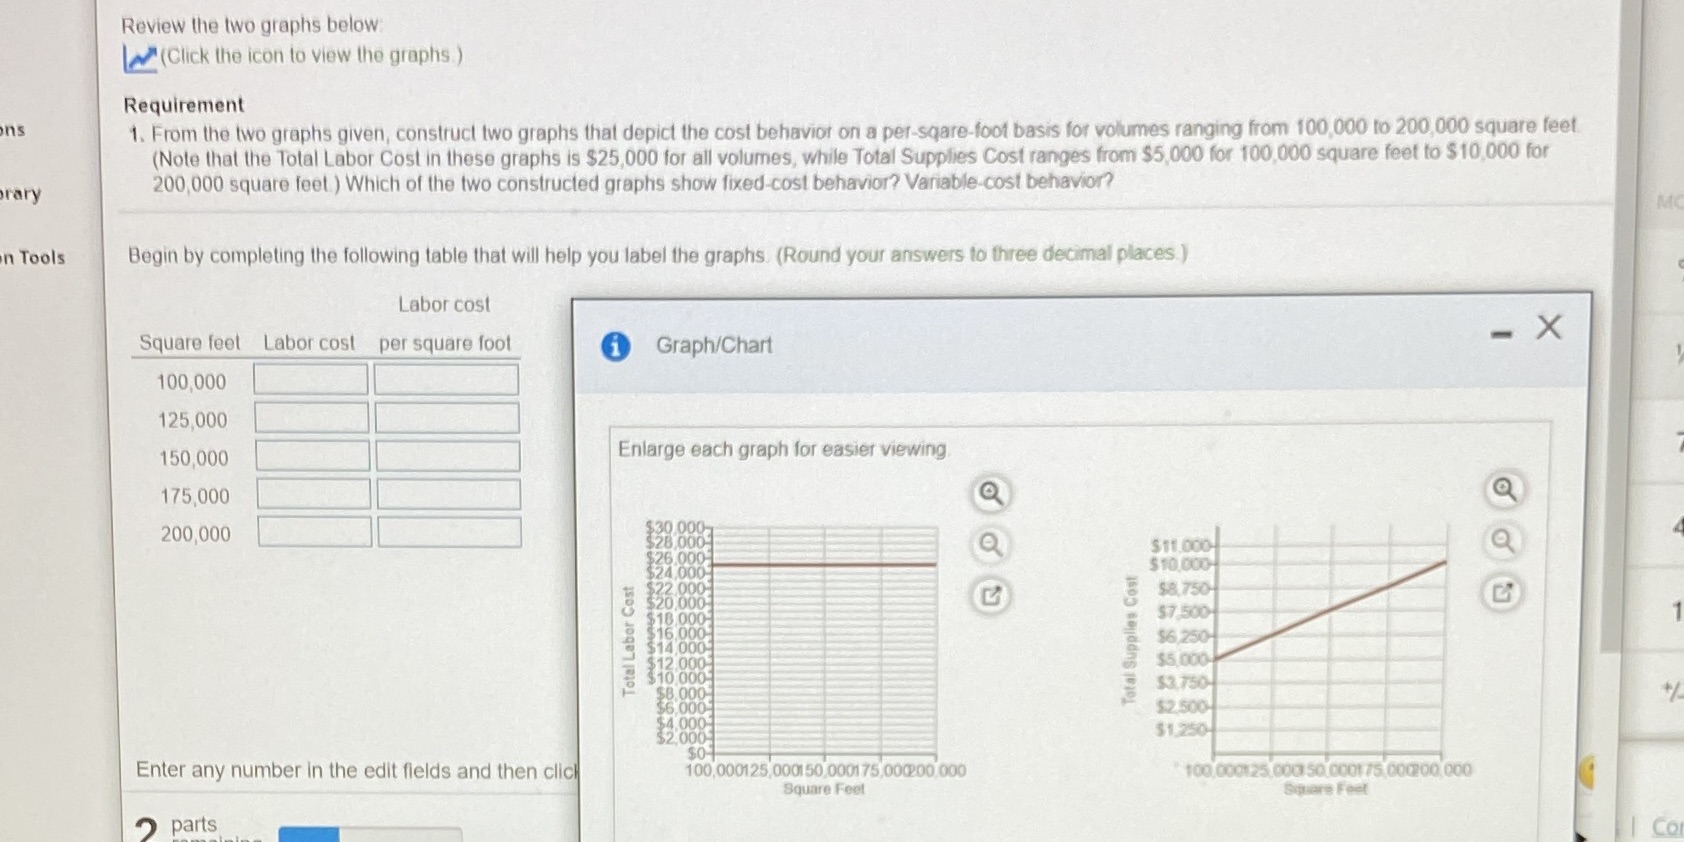
Review the two graphs below: (Click the icon to view the graphs.) Requirement ns 1. From the two graphs given, construct two graphs that depict the cost behavior on a per-sqare-foot basis for volumes ranging from 100,000 to 200,000 square feet (Note that the Total Labor Cost in these graphs is $25,000 for all volumes, while Total Supplies Cost ranges from $5,000 for 100,000 square feet to $10,000 for rary 200,000 square feet ) Which of the two constructed graphs show fixed-cost behavior? Variable-cost behavior? n Tools Begin by completing the following table that will help you label the graphs. (Round your answers to three decimal places.) Labor cost Square feet Labor cost per square foot 1 Graph/Chart - X 100,000 125,000 150,000 Enlarge each graph for easier viewing 175,000 200,000 $30 000 $28 000 $26.000 $11.000- $24,000 $10.000 $22,900 $20,000 $8,750- $18 000- $7.500 $16 000 Total Labor Cost $14 000 Total Supplies Cost $6,250- $12 000 $5,000- $10 000 $8,000 $3.750 $6,000 $2.500 $4.000 $2 000 $1.250 SO Enter any number in the edit fields and then click 100,000125,0001 50,000175,00(200,000 100 000125.000 50/0001 75 00(200 000 Square Feet Square Feet 2 parts
Step by Step Solution
There are 3 Steps involved in it

Get step-by-step solutions from verified subject matter experts