

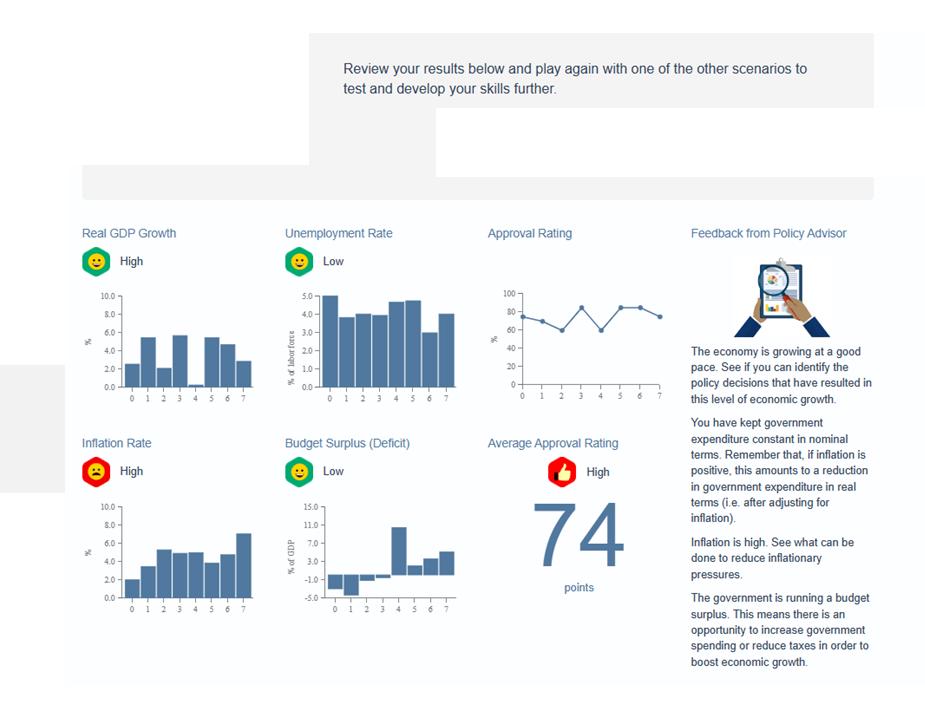
Review your results below and play again with one of the other scenarios to test and...
Fantastic news! We've Found the answer you've been seeking!
Question:
Transcribed Image Text:
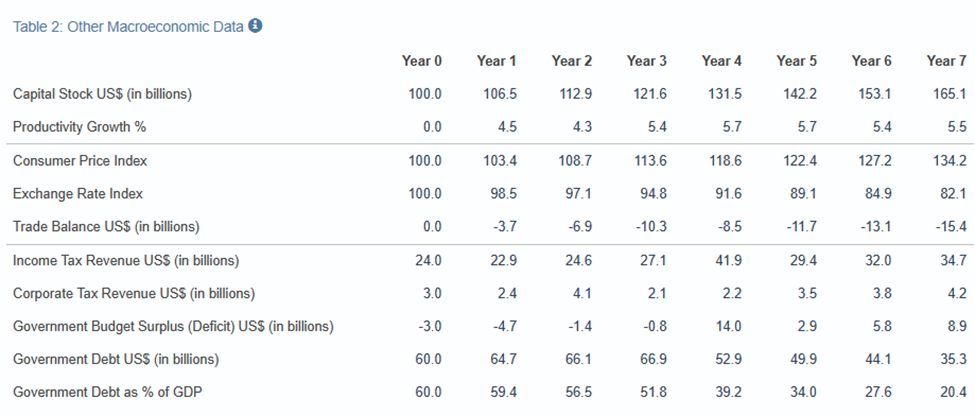
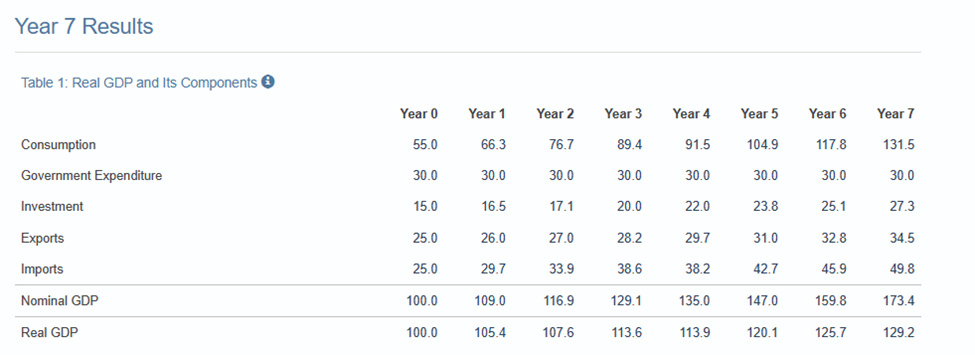
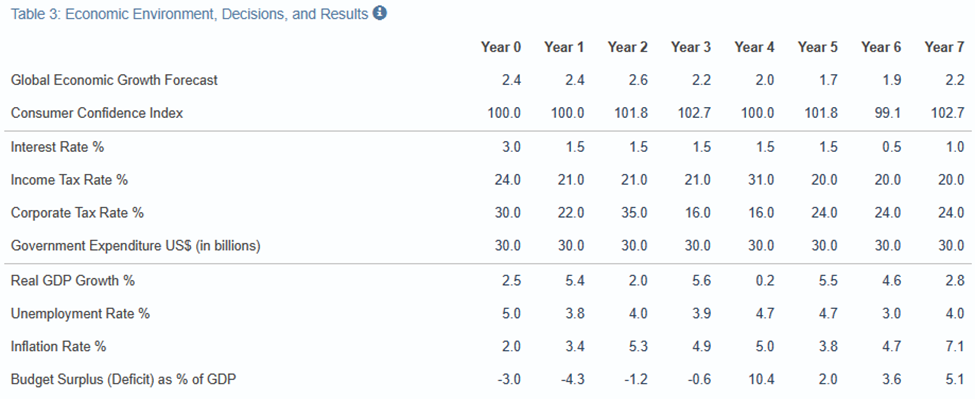
Review your results below and play again with one of the other scenarios to test and develop your skills further. Real GDP Growth High Unemployment Rate Low Approval Rating Feedback from Policy Advisor 10.0 8.0- 6.0 4.0- 20- 0.0- 0 1 2 3 4 5 6 7 Inflation Rate 10.0 High 8.0- 6.0- 4.0- 20- 0.0 01234567 $67 % of labor force 5.0 4.0 3.0 20- 1.0- 0.0 0 1 2 3 4 Budget Surplus (Deficit) % of GDP 15.0- 11.0 7.0- 3.0- -1.0- -5.0 Low L 0 1 2 3 4 5 6 100- 80- 60- 40- 20- T 0 1 2 3 Average Approval Rating High 74 points The economy is growing at a good pace. See if you can identify the policy decisions that have resulted in this level of economic growth. You have kept government expenditure constant in nominal terms. Remember that, if inflation is positive, this amounts to a reduction in government expenditure in real terms (ie. after adjusting for inflation). Inflation is high. See what can be done to reduce inflationary pressures. The government is running a budget surplus. This means there is an opportunity to increase government spending or reduce taxes in order to boost economic growth. Table 2: Other Macroeconomic Data Year 0 Year 1 Year 2 Year 3 Year 4 Year 5 Year 6 Year 7 Capital Stock US$ (in billions) Productivity Growth % 100.0 106.5 112.9 121.6 131.5 142.2 153.1 165.1 0.0 4.5 4.3 5.4 5.7 5.7 5.4 5.5 Consumer Price Index Exchange Rate Index Trade Balance US$ (in billions) 100.0 103.4 108.7 113.6 118.6 122.4 127.2 134.2 100.0 98.5 97.1 94.8 91.6 89.1 84.9 82.1 0.0 -3.7 -6.9 -10.3 -8.5 -11.7 -13.1 -15.4 Income Tax Revenue US$ (in billions) 24.0 22.9 24.6 27.1 41.9 29.4 32.0 34.7 Corporate Tax Revenue US$ (in billions) 3.0 2.4 4.1 2.1 2.2 3.5 3.8 4.2 Government Budget Surplus (Deficit) US$ (in billions) -3.0 -4.7 -1.4 -0.8 14.0 2.9 5.8 8.9 Government Debt US$ (in billions) 60.0 64.7 66.1 66.9 52.9 49.9 44.1 35.3 Government Debt as % of GDP 60.0 59.4 56.5 51.8 39.2 34.0 27.6 20.4 Year 7 Results Table 1: Real GDP and Its Components Year 0 Year 1 Year 2 Year 3 Year 4 Year 5 Year 6 Year 7 Consumption 55.0 66.3 76.7 89.4 91.5 104.9 117.8 131.5 Government Expenditure 30.0 30.0 30.0 30.0 30.0 30.0 30.0 30.0 Investment 15.0 16.5 17.1 20.0 22.0 23.8 25.1 27.3 Exports 25.0 26.0 27.0 28.2 29.7 31.0 32.8 34.5 Imports 25.0 29.7 33.9 38.6 38.2 42.7 45.9 49.8 Nominal GDP 100.0 109.0 116.9 129.1 135.0 147.0 159.8 173.4 Real GDP 100.0 105.4 107.6 113.6 113.9 120.1 125.7 129.2 Table 3: Economic Environment, Decisions, and Results Year 0 Year 1 Year 2 Year 3 Year 4 Year 5 Year 6 Year 7 Global Economic Growth Forecast 2.4 2.4 2.6 2.2 2.0 1.7 1.9 2.2 Consumer Confidence Index 100.0 100.0 101.8 102.7 100.0 101.8 99.1 102.7 Interest Rate % 3.0 1.5 1.5 1.5 1.5 1.5 0.5 1.0 Income Tax Rate % 24.0 21.0 21.0 21.0 31.0 20.0 20.0 20.0 Corporate Tax Rate % 30.0 22.0 35.0 16.0 16.0 24.0 24.0 24.0 Government Expenditure US$ (in billions) 30.0 30.0 30.0 30.0 30.0 30.0 30.0 30.0 Real GDP Growth % 2.5 5.4 2.0 5.6 0.2 5.5 4.6 2.8 Unemployment Rate % 5.0 3.8 4.0 3.9 4.7 4.7 3.0 4.0 Inflation Rate % 2.0 3.4 5.3 4.9 5.0 3.8 4.7 7.1 Budget Surplus (Deficit) as % of GDP -3.0 -4.3 -1.2 -0.6 10.4 2.0 3.6 5.1 Review your results below and play again with one of the other scenarios to test and develop your skills further. Real GDP Growth High Unemployment Rate Low Approval Rating Feedback from Policy Advisor 10.0 8.0- 6.0 4.0- 20- 0.0- 0 1 2 3 4 5 6 7 Inflation Rate 10.0 High 8.0- 6.0- 4.0- 20- 0.0 01234567 $67 % of labor force 5.0 4.0 3.0 20- 1.0- 0.0 0 1 2 3 4 Budget Surplus (Deficit) % of GDP 15.0- 11.0 7.0- 3.0- -1.0- -5.0 Low L 0 1 2 3 4 5 6 100- 80- 60- 40- 20- T 0 1 2 3 Average Approval Rating High 74 points The economy is growing at a good pace. See if you can identify the policy decisions that have resulted in this level of economic growth. You have kept government expenditure constant in nominal terms. Remember that, if inflation is positive, this amounts to a reduction in government expenditure in real terms (ie. after adjusting for inflation). Inflation is high. See what can be done to reduce inflationary pressures. The government is running a budget surplus. This means there is an opportunity to increase government spending or reduce taxes in order to boost economic growth. Table 2: Other Macroeconomic Data Year 0 Year 1 Year 2 Year 3 Year 4 Year 5 Year 6 Year 7 Capital Stock US$ (in billions) Productivity Growth % 100.0 106.5 112.9 121.6 131.5 142.2 153.1 165.1 0.0 4.5 4.3 5.4 5.7 5.7 5.4 5.5 Consumer Price Index Exchange Rate Index Trade Balance US$ (in billions) 100.0 103.4 108.7 113.6 118.6 122.4 127.2 134.2 100.0 98.5 97.1 94.8 91.6 89.1 84.9 82.1 0.0 -3.7 -6.9 -10.3 -8.5 -11.7 -13.1 -15.4 Income Tax Revenue US$ (in billions) 24.0 22.9 24.6 27.1 41.9 29.4 32.0 34.7 Corporate Tax Revenue US$ (in billions) 3.0 2.4 4.1 2.1 2.2 3.5 3.8 4.2 Government Budget Surplus (Deficit) US$ (in billions) -3.0 -4.7 -1.4 -0.8 14.0 2.9 5.8 8.9 Government Debt US$ (in billions) 60.0 64.7 66.1 66.9 52.9 49.9 44.1 35.3 Government Debt as % of GDP 60.0 59.4 56.5 51.8 39.2 34.0 27.6 20.4 Year 7 Results Table 1: Real GDP and Its Components Year 0 Year 1 Year 2 Year 3 Year 4 Year 5 Year 6 Year 7 Consumption 55.0 66.3 76.7 89.4 91.5 104.9 117.8 131.5 Government Expenditure 30.0 30.0 30.0 30.0 30.0 30.0 30.0 30.0 Investment 15.0 16.5 17.1 20.0 22.0 23.8 25.1 27.3 Exports 25.0 26.0 27.0 28.2 29.7 31.0 32.8 34.5 Imports 25.0 29.7 33.9 38.6 38.2 42.7 45.9 49.8 Nominal GDP 100.0 109.0 116.9 129.1 135.0 147.0 159.8 173.4 Real GDP 100.0 105.4 107.6 113.6 113.9 120.1 125.7 129.2 Table 3: Economic Environment, Decisions, and Results Year 0 Year 1 Year 2 Year 3 Year 4 Year 5 Year 6 Year 7 Global Economic Growth Forecast 2.4 2.4 2.6 2.2 2.0 1.7 1.9 2.2 Consumer Confidence Index 100.0 100.0 101.8 102.7 100.0 101.8 99.1 102.7 Interest Rate % 3.0 1.5 1.5 1.5 1.5 1.5 0.5 1.0 Income Tax Rate % 24.0 21.0 21.0 21.0 31.0 20.0 20.0 20.0 Corporate Tax Rate % 30.0 22.0 35.0 16.0 16.0 24.0 24.0 24.0 Government Expenditure US$ (in billions) 30.0 30.0 30.0 30.0 30.0 30.0 30.0 30.0 Real GDP Growth % 2.5 5.4 2.0 5.6 0.2 5.5 4.6 2.8 Unemployment Rate % 5.0 3.8 4.0 3.9 4.7 4.7 3.0 4.0 Inflation Rate % 2.0 3.4 5.3 4.9 5.0 3.8 4.7 7.1 Budget Surplus (Deficit) as % of GDP -3.0 -4.3 -1.2 -0.6 10.4 2.0 3.6 5.1
Expert Answer:

Related Book For 

Posted Date:
Students also viewed these economics questions
-
for this case study carefully read the article titled "The Case for Reparations" The Atlantic Introduction Provide an overview of the situation Identify critical issues underlying the problems...
-
Draw a total setup outline and decide the expense for the most economical design, i.e., the one where the complete expense of the correspondences circuits and equpment is the least. (b) The...
-
Certain companies regard the management of cultural diversity as a way of developing new competencies that give them certain advantages. They are, for example, able to recruit and hold on to good...
-
On September 11, 2002, the first anniversary of the terrorist attack on the World Trade Center, the New York State Lottery's daily number came up 9-1-1. An interesting coincidence or a cosmic sign?...
-
Dinettes Inc. operates at capacity and makes glass-topped dining tables and wooden chairs that are typically sold as sets of four chairs with one table. However, some customers purchase replacement...
-
The Lewis-Randall rule is applicable (a) At high pressures (b) At low pressures when the gas mixture behaves as an ideal solution (c) At low temperature (d) At low temperature and high pressure.
-
Raynhams Radiology Center (RRC) performs X-rays, ultrasounds, computer tomography (CT) scans, and magnetic resonance imaging (MRI). RRC has developed a reputation as a top radiology center in the...
-
Jackson, a self-employed taxpayer, uses his automobile 90% for business and during 2023 drove a total of 15,000 business miles. Information regarding his car expenses is listed below. Business...
-
On September 9, Wholly Crepe purchased flour at a cost of $4,500 and credit terms of 5/10, n/20. After returning $300 of flour to the seller, what is the correct amount it should pay to the seller on...
-
A large part of my evaluation of your paper will be based on how well you have substantiated your arguments. I will look to see whether your position and opinions are based on sound economic...
-
Last month when Holiday Creations, Incorporated, sold 4 1 , 0 0 0 units, total sales were $ 1 6 4 , 0 0 0 , total variable expenses were $ 1 3 7 , 7 6 0 , and fixed expenses were $ 3 9 , 9 0 0 . What...
-
Summarize your observations of the local news media stories over a three-week period. Explain how the media influences the criminal justice policy process. Analyze the news stories to determine how...
-
The zero-tolerance policing concept examines the positives and negatives of the approach. Determine the effects of the criminal justice policy on the other elements of the criminal justice community,...
-
1: In what way might a referral/reference mention help in the cover letter process? Please explain. (1 mark) 2: For a job of Accountant Paragraph 3 is an important component of the cover letter....
-
Prepare an income statement and a balance sheet for the coffee hut for a future year. Then you will various ratio analyses, and a contribution margin analyses to see how sues business is doing. The...
-
What are bounds and what do companies do with them?
-
(a) A company uses a process costing system in which the following terms arise: conversion costs work-in-process equivalent units normal loss abnormal loss. Required: Provide a definition of each of...
-
(a) Explain briefly the term joint products in the context of process costing. (b) Discuss whether, and if so how, joint process costs should be shared among joint products. (Assume that no further...
-
Define joint costs, split-off point and further processing costs.

Study smarter with the SolutionInn App