

Question: Risk and return estimates (4 marks): Use CAPM to estimate the expected return for the shares of: i) your case company; and ii) a hypothetical
-
Risk and return estimates (4 marks):
-
Use CAPM to estimate the expected return for the shares of: i) your case company; and ii) a hypothetical company with a beta of 1.40. To do this, use the yield to maturity of a 10-year Australian Government bond on 29 March 2021 as a proxy for the risk-free rate, assume the market risk premium is 5% and use your case companys current 5-year beta.
-
Using the data from part 2a, estimate portfolio expected return and beta, assuming a portfolio with 20% invested in your case company and the remainder invested in the hypothetical company
3. Risk and return analysis (15 marks): pls answer Q3 with Q2 toghther , thanks so much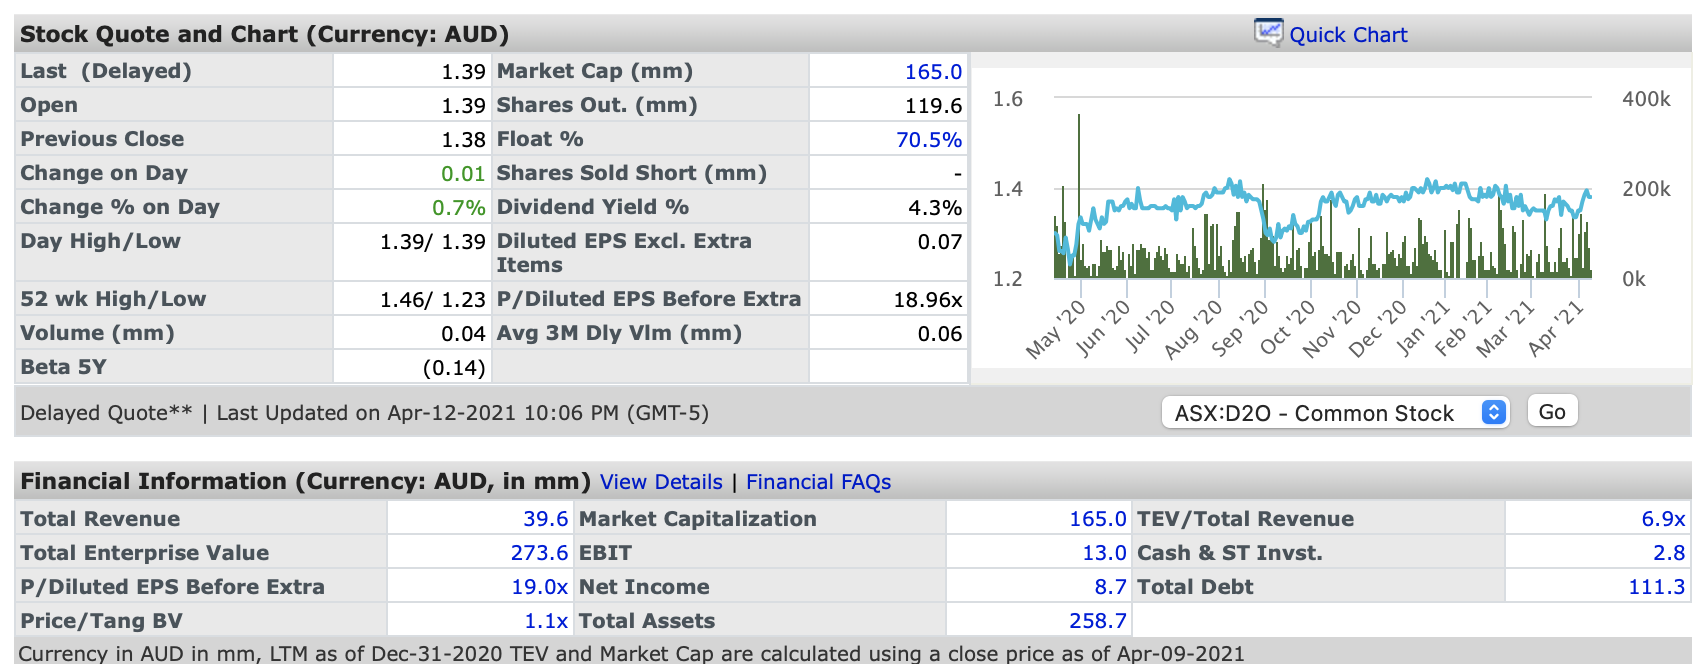
-
Quick Chart 165.0 119.6 1.6 400k 70.5% 1.4 200k Stock Quote and Chart (Currency: AUD) Last (Delayed) 1.39 Market Cap (mm) Open 1.39 Shares Out. (mm) Previous Close 1.38 Float % Change on Day 0.01 Shares Sold Short (mm) Change % on Day 0.7% Dividend Yield % Day High/Low 1.39/ 1.39 Diluted EPS Excl. Extra Items 52 wk High/Low 1.46/ 1.23 P/Diluted EPS Before Extra Volume (mm) 0.04 Avg 3M Dly Vlm (mm) Beta 5Y (0.14) 4.3% 0.07 1.2 Ok 18.96x Jul '20 May '20 Jun 20 0.06 Aug '20 Sep 20 Feb 21 Mar 21 Jan 21 Nov '20 Dec '20 Apr 21 Oct 20 Delayed Quote** | Last Updated on Apr-12-2021 10:06 PM (GMT-5) ASX:D20 - Common Stock Go 6.9x Financial Information (Currency: AUD, in mm) View Details | Financial FAQs Total Revenue 39.6 Market Capitalization 165.0 TEV/Total Revenue Total Enterprise Value 273.6 EBIT 13.0 Cash & ST Invst. P/Diluted EPS Before Extra 19.0x Net Income 8.7 Total Debt Price/Tang BV 1.1x Total Assets 258.7 Currency in AUD in mm, LTM as of Dec-31-2020 TEV and Market Cap are calculated using a close price as of Apr-09-2021 2.8 111.3 Quick Chart 165.0 119.6 1.6 400k 70.5% 1.4 200k Stock Quote and Chart (Currency: AUD) Last (Delayed) 1.39 Market Cap (mm) Open 1.39 Shares Out. (mm) Previous Close 1.38 Float % Change on Day 0.01 Shares Sold Short (mm) Change % on Day 0.7% Dividend Yield % Day High/Low 1.39/ 1.39 Diluted EPS Excl. Extra Items 52 wk High/Low 1.46/ 1.23 P/Diluted EPS Before Extra Volume (mm) 0.04 Avg 3M Dly Vlm (mm) Beta 5Y (0.14) 4.3% 0.07 1.2 Ok 18.96x Jul '20 May '20 Jun 20 0.06 Aug '20 Sep 20 Feb 21 Mar 21 Jan 21 Nov '20 Dec '20 Apr 21 Oct 20 Delayed Quote** | Last Updated on Apr-12-2021 10:06 PM (GMT-5) ASX:D20 - Common Stock Go 6.9x Financial Information (Currency: AUD, in mm) View Details | Financial FAQs Total Revenue 39.6 Market Capitalization 165.0 TEV/Total Revenue Total Enterprise Value 273.6 EBIT 13.0 Cash & ST Invst. P/Diluted EPS Before Extra 19.0x Net Income 8.7 Total Debt Price/Tang BV 1.1x Total Assets 258.7 Currency in AUD in mm, LTM as of Dec-31-2020 TEV and Market Cap are calculated using a close price as of Apr-09-2021 2.8 111.3
Step by Step Solution
There are 3 Steps involved in it

Get step-by-step solutions from verified subject matter experts