

Question: Risk and Return Exercises: On January 2, 2019, you plan to invest $1,000,000 in three stocks to form a portfolio: $300,000 in Stock A, $300,000
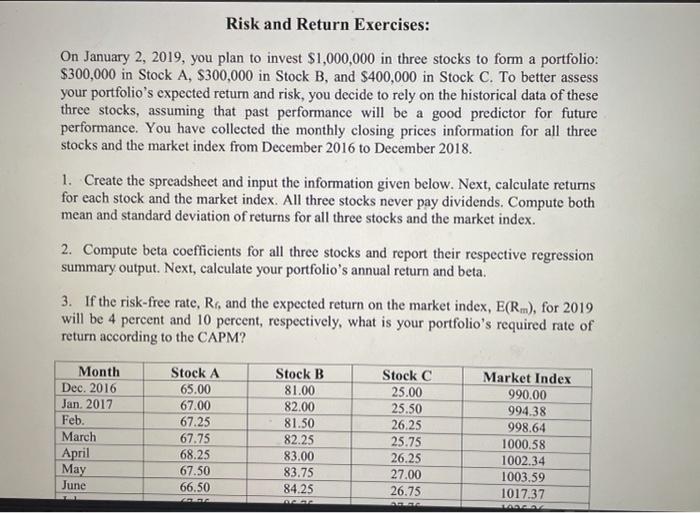
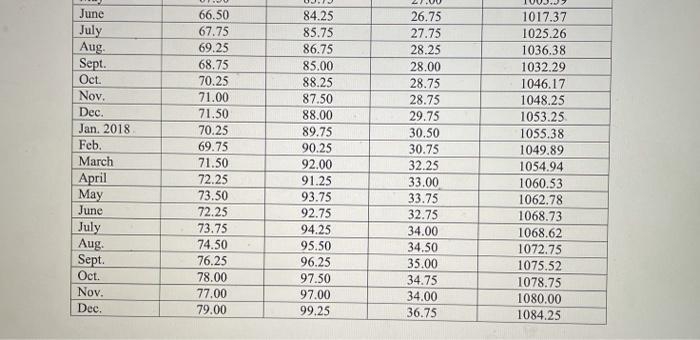
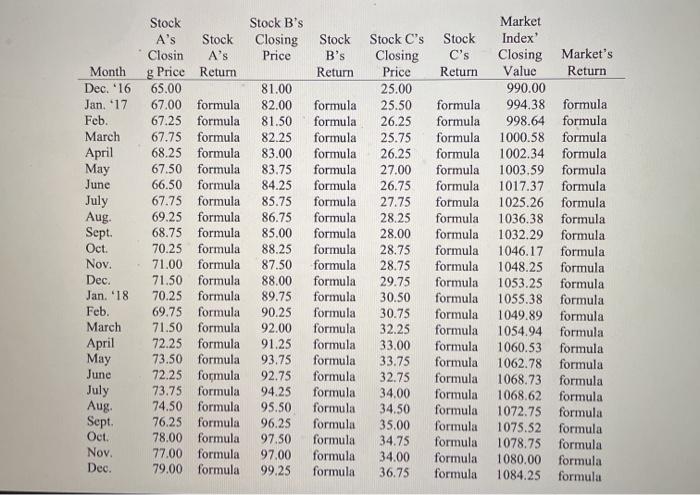
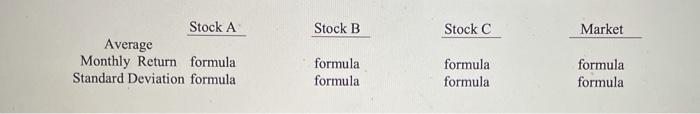
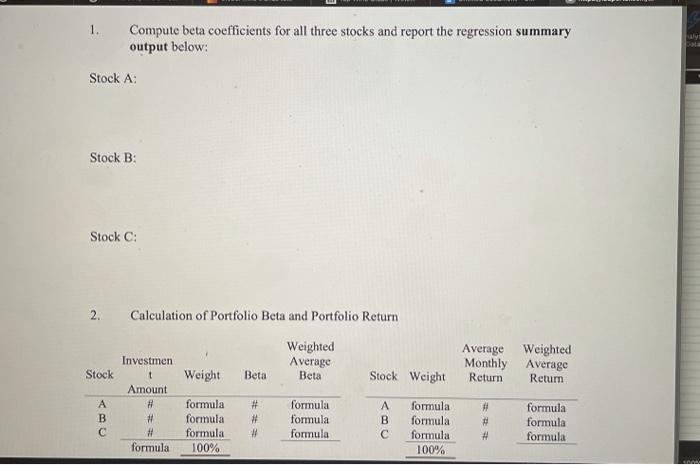
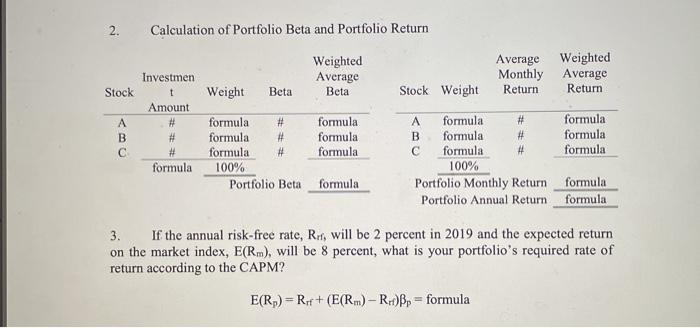
Risk and Return Exercises: On January 2, 2019, you plan to invest $1,000,000 in three stocks to form a portfolio: $300,000 in Stock A, $300,000 in Stock B, and $400,000 in Stock C. To better assess your portfolio's expected return and risk, you decide to rely on the historical data of these three stocks, assuming that past performance will be a good predictor for future performance. You have collected the monthly closing prices information for all three stocks and the market index from December 2016 to December 2018. 1. Create the spreadsheet and input the information given below. Next, calculate returns for each stock and the market index. All three stocks never pay dividends. Compute both mean and standard deviation of returns for all three stocks and the market index. 2. Compute beta coefficients for all three stocks and report their respective regression summary output. Next, calculate your portfolio's annual return and beta. 3. If the risk-free rate, R. and the expected return on the market index, E(R..), for 2019 will be 4 percent and 10 percent, respectively, what is your portfolio's required rate of return according to the CAPM? Month Dec. 2016 Jan. 2017 Feb. March April May June Stock A 65.00 67.00 67.25 67.75 68.25 67.50 66.50 Stock B 81.00 82.00 81.50 82.25 83.00 83.75 84.25 Stock C 25.00 25.50 26.25 25.75 26.25 27.00 26.75 Market Index 990.00 994.38 998.64 1000.58 1002.34 1003.59 1017.37 LA June July Aug. Sept. Oct. Nov. Dec. Jan. 2018 Feb. March April May June July Aug. Sept. Oct. Nov. Dec. 66.50 67.75 69.25 68.75 70.25 71.00 71.50 70.25 69.75 71.50 72.25 73.50 72.25 73.75 74.50 76.25 78.00 77.00 79.00 84.25 85.75 86.75 85.00 88.25 87.50 88.00 89.75 90.25 92.00 91.25 93.75 92.75 94.25 95.50 96.25 97.50 97.00 99.25 26.75 27.75 28.25 28.00 28.75 28.75 29.75 30.50 30.75 32.25 33.00 33.75 32.75 34.00 34.50 35.00 34.75 34.00 36.75 1017.37 1025.26 1036.38 1032.29 1046.17 1048.25 1053.25 1055.38 1049.89 1054.94 1060.53 1062.78 1068.73 1068.62 1072.75 1075.52 1078.75 1080.00 1084.25 Stock B's Return Month Dec. '16 Jan. 17 Feb. March April May June July Aug Sept. Oct. Nov. Dec. Jan. 18 Feb. March April May June July Aug Sept. Oct. Nov. Dec. Stock Stock B's A's Stock Closing Closin A's Price g Price Return 65.00 81.00 67.00 formula 82.00 67.25 formula 81.50 67.75 formula 82.25 68.25 formula 83.00 67.50 formula 83.75 66.50 formula 84.25 67.75 formula 85.75 69.25 formula 86.75 68.75 formula 85.00 70.25 formula 88.25 71.00 formula 87.50 71.50 formula 88.00 70.25 formula 89.75 69.75 formula 90.25 71.50 formula 92.00 72.25 formula 91.25 73.50 formula 93.75 72.25 formula 92.75 73.75 formula 94.25 74.50 formula 95.50 76.25 formula 96.25 8.00 formula 97.50 77.00 formula 97.00 79.00 formula 99.25 formula formula formula formula formula formula formula formula formula formula formula formula formula formula formula formula formula formula formula formula formula formula formula formula Market Stock C's Stock Index Closing C's Closing Market's Price Return Value Return 25.00 990.00 25.50 formula 994.38 formula 26.25 formula 998.64 formula 25.75 formula 1000.58 formula 26.25 formula 1002.34 formula 27.00 formula 1003.59 formula 26.75 formula 1017.37 formula 27.75 formula 1025.26 formula 28.25 formula 1036.38 formula 28.00 formula 1032.29 formula 28.75 formula 1046.17 formula 28.75 formula 1048.25 formula 29.75 formula 1053.25 formula 30.50 formula 1055.38 formula 30.75 formula 1049.89 formula 32.25 formula 1054.94 formula 33.00 formula 1060.53 formula 33.75 formula 1062.78 formula 32.75 formula 1068.73 formula 34.00 formula 1068.62 formula 34.50 formula 1072.75 formula 35.00 formula 1075.52 formula 34.75 formula 1078.75 formula 34.00 formula 1080.00 formula 36.75 formula 1084.25 formula Stock B Stock C Market Stock A Average Monthly Return formula Standard Deviation formula formula formula formula formula formula formula 1. Compute beta coefficients for all three stocks and report the regression summary output below: wy Stock A: Stock B: Stock C: 2. Calculation of Portfolio Beta and Portfolio Return Weighted Average Beta Average Weighted Monthly Average Return Retum Stock Weight Beta Stock Weight Investmen 1 Amount # # # formula B C # formula formula formula 100% formula formula formula A B C # # formula formula formula 100% formula formula formula # # Risk and Return Exercises: On January 2, 2019, you plan to invest $1,000,000 in three stocks to form a portfolio: $300,000 in Stock A, $300,000 in Stock B, and $400,000 in Stock C. To better assess your portfolio's expected return and risk, you decide to rely on the historical data of these three stocks, assuming that past performance will be a good predictor for future performance. You have collected the monthly closing prices information for all three stocks and the market index from December 2016 to December 2018. 1. Create the spreadsheet and input the information given below. Next, calculate returns for each stock and the market index. All three stocks never pay dividends. Compute both mean and standard deviation of returns for all three stocks and the market index. 2. Compute beta coefficients for all three stocks and report their respective regression summary output. Next, calculate your portfolio's annual return and beta. 3. If the risk-free rate, R. and the expected return on the market index, E(R..), for 2019 will be 4 percent and 10 percent, respectively, what is your portfolio's required rate of return according to the CAPM? Month Dec. 2016 Jan. 2017 Feb. March April May June Stock A 65.00 67.00 67.25 67.75 68.25 67.50 66.50 Stock B 81.00 82.00 81.50 82.25 83.00 83.75 84.25 Stock C 25.00 25.50 26.25 25.75 26.25 27.00 26.75 Market Index 990.00 994.38 998.64 1000.58 1002.34 1003.59 1017.37 LA June July Aug. Sept. Oct. Nov. Dec. Jan. 2018 Feb. March April May June July Aug. Sept. Oct. Nov. Dec. 66.50 67.75 69.25 68.75 70.25 71.00 71.50 70.25 69.75 71.50 72.25 73.50 72.25 73.75 74.50 76.25 78.00 77.00 79.00 84.25 85.75 86.75 85.00 88.25 87.50 88.00 89.75 90.25 92.00 91.25 93.75 92.75 94.25 95.50 96.25 97.50 97.00 99.25 26.75 27.75 28.25 28.00 28.75 28.75 29.75 30.50 30.75 32.25 33.00 33.75 32.75 34.00 34.50 35.00 34.75 34.00 36.75 1017.37 1025.26 1036.38 1032.29 1046.17 1048.25 1053.25 1055.38 1049.89 1054.94 1060.53 1062.78 1068.73 1068.62 1072.75 1075.52 1078.75 1080.00 1084.25 Stock B's Return Month Dec. '16 Jan. 17 Feb. March April May June July Aug Sept. Oct. Nov. Dec. Jan. 18 Feb. March April May June July Aug Sept. Oct. Nov. Dec. Stock Stock B's A's Stock Closing Closin A's Price g Price Return 65.00 81.00 67.00 formula 82.00 67.25 formula 81.50 67.75 formula 82.25 68.25 formula 83.00 67.50 formula 83.75 66.50 formula 84.25 67.75 formula 85.75 69.25 formula 86.75 68.75 formula 85.00 70.25 formula 88.25 71.00 formula 87.50 71.50 formula 88.00 70.25 formula 89.75 69.75 formula 90.25 71.50 formula 92.00 72.25 formula 91.25 73.50 formula 93.75 72.25 formula 92.75 73.75 formula 94.25 74.50 formula 95.50 76.25 formula 96.25 8.00 formula 97.50 77.00 formula 97.00 79.00 formula 99.25 formula formula formula formula formula formula formula formula formula formula formula formula formula formula formula formula formula formula formula formula formula formula formula formula Market Stock C's Stock Index Closing C's Closing Market's Price Return Value Return 25.00 990.00 25.50 formula 994.38 formula 26.25 formula 998.64 formula 25.75 formula 1000.58 formula 26.25 formula 1002.34 formula 27.00 formula 1003.59 formula 26.75 formula 1017.37 formula 27.75 formula 1025.26 formula 28.25 formula 1036.38 formula 28.00 formula 1032.29 formula 28.75 formula 1046.17 formula 28.75 formula 1048.25 formula 29.75 formula 1053.25 formula 30.50 formula 1055.38 formula 30.75 formula 1049.89 formula 32.25 formula 1054.94 formula 33.00 formula 1060.53 formula 33.75 formula 1062.78 formula 32.75 formula 1068.73 formula 34.00 formula 1068.62 formula 34.50 formula 1072.75 formula 35.00 formula 1075.52 formula 34.75 formula 1078.75 formula 34.00 formula 1080.00 formula 36.75 formula 1084.25 formula Stock B Stock C Market Stock A Average Monthly Return formula Standard Deviation formula formula formula formula formula formula formula 1. Compute beta coefficients for all three stocks and report the regression summary output below: wy Stock A: Stock B: Stock C: 2. Calculation of Portfolio Beta and Portfolio Return Weighted Average Beta Average Weighted Monthly Average Return Retum Stock Weight Beta Stock Weight Investmen 1 Amount # # # formula B C # formula formula formula 100% formula formula formula A B C # # formula formula formula 100% formula formula formula # #
Step by Step Solution
There are 3 Steps involved in it

Get step-by-step solutions from verified subject matter experts