

Question: risk free rate?? Den spreadsheet a. Use a spreadsheet (or a calculator with a linear regression function) to determine Stock X's beta coefficient. Do not
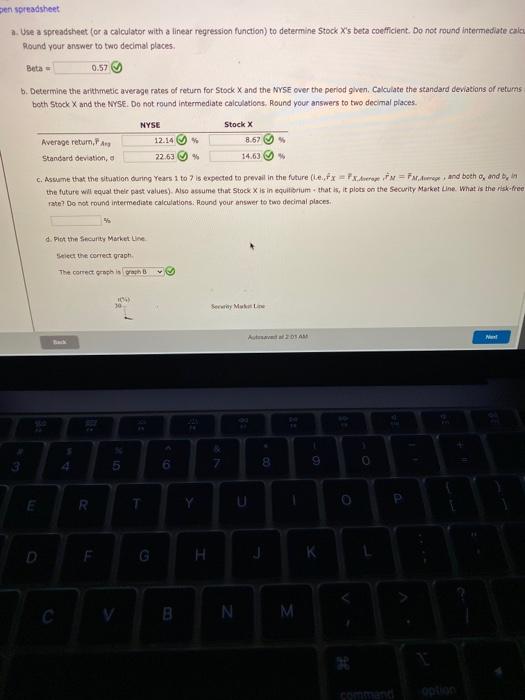
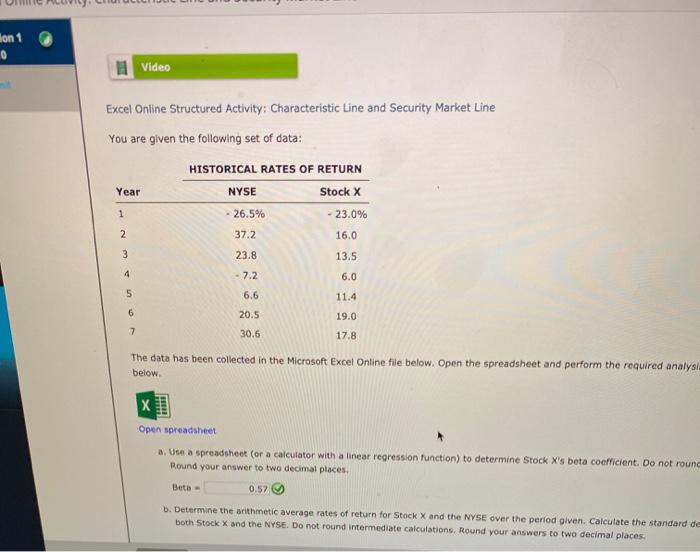
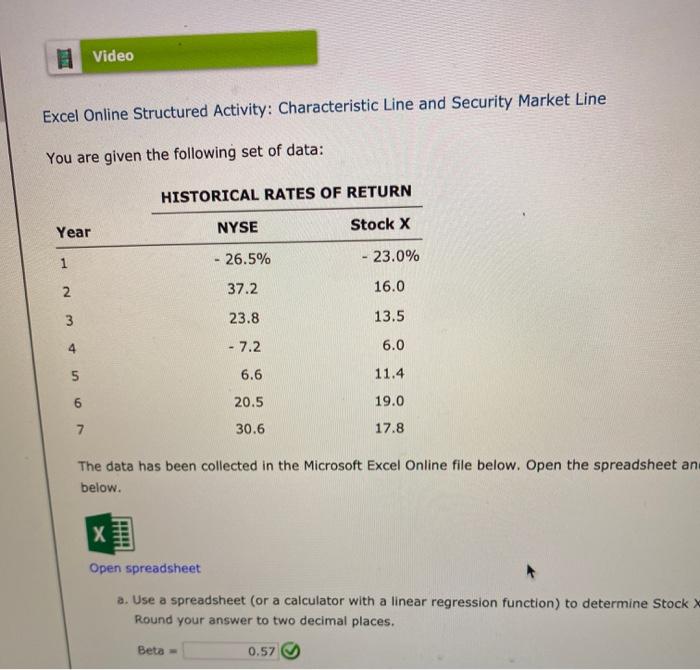
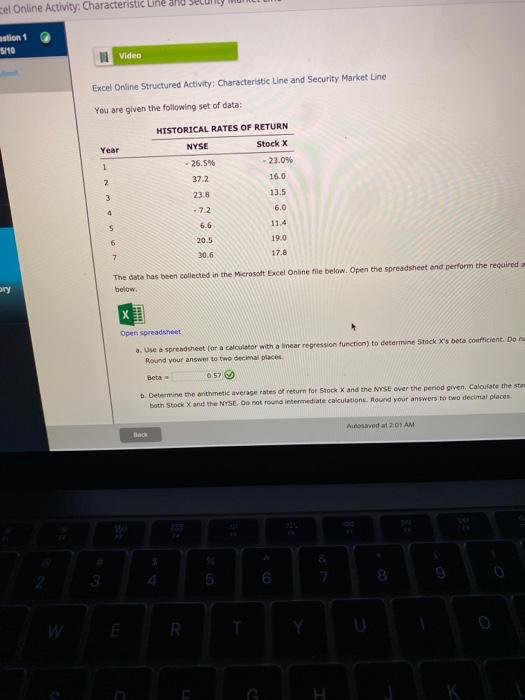
Den spreadsheet a. Use a spreadsheet (or a calculator with a linear regression function) to determine Stock X's beta coefficient. Do not round intermediate calcu Round your answer to two decimal places Beta 0.57 b. Determine the arithmetic average rates of return for Stock and the NYSE over the period given. Calculate the standard deviations of returns both Stock X and the NYSE. Do not round intermediate calculations, Round your answers to two decimal places Stock X Average return,FAID 12.14 8.67 Standard deviation, 22.63 C. Assume that the tuation during Years 1 to 7 is expected to prevall in the future (e, fx = Pxwin Flures, and both o, and by the future will equal the past values). Also assume that Stock X is in equilibrium that is it plots on the Security Market Line What is the risk-free rate? Do not round Intermediate calculations. Round your answer to two decimal places NYSE 14.63 d. Por the security Market Line Select the correct graphi The correct graph is gran vo 10 See M Ats 5 8 E R N M. im and Ion 1 0 11 Video Excel Online Structured Activity: Characteristic Line and Security Market Line You are given the following set of data: HISTORICAL RATES OF RETURN Stock X Year NYSE 1 - 26.5% 23.0% 2 37.2 16.0 3 23.8 13.5 4 - 7.2 6.0 5 6.6 11.4 6 20.5 19.0 7 30.6 17.8 The data has been collected in the Microsoft Excel Online file below. Open the spreadsheet and perform the required analysi below X Open spreadsheet a. Use a spreadsheet (or a calculator with a linear regression function) to determine Stock X's beta coefficient. Do not round Round your answer to two decimal places, Beta- 0.57 b. Determine the arithmetic average rates of return for Stock X and the NYSE over the period given. Calculate the standard de both Stock X and the NYSE. Do not round intermediate calculations. Round your answers to two decimal places. Video Excel Online Structured Activity: Characteristic Line and Security Market Line You are given the following set of data: HISTORICAL RATES OF RETURN Year NYSE Stock X 1 - 26.5% - 23.0% 2. 37.2 16.0 23.8 13.5 - 7.2 6.0 No 6.6 11.4 20.5 19.0 30.6 17.8 The data has been collected in the Microsoft Excel Online file below. Open the spreadsheet an below. X Open spreadsheet a. Use a spreadsheet (or a calculator with a linear regression function) to determine Stock Round your answer to two decimal places. Beta 0.57 cel Online Activity: Characteristic Line and astion 1 5/10 Video Excel Online Structured Activity: Characteristic Line and Security Market Line You are given the following set of data: Year 1 HISTORICAL RATES OF RETURN NYSE Stock X - 26.5% - 23.0% 37.2 16.0 23.8 13.5 -72 6.0 2 3 4 6.6 11.4 5 6 20.5 19.0 7 17.8 30.6 The data has been collected in the Microsoft Excel Online file below. Open the spreadsheet and perform the required below. ory Open spreadsheet a. Use spreadsheet (or a calculator with a linear regression function) to determine Stock X's beta coefficient. Do ne Round your answer to two decimal places Beta Determine the arithmetic average rates of return for Stock X and the NSE over the period given. Calculate the sta both stock and the NYSE. Do not found intermediate calculations. Round your answers to two decimal places Autosaved at 201 AM Red 8 W RSS
Step by Step Solution
There are 3 Steps involved in it

Get step-by-step solutions from verified subject matter experts