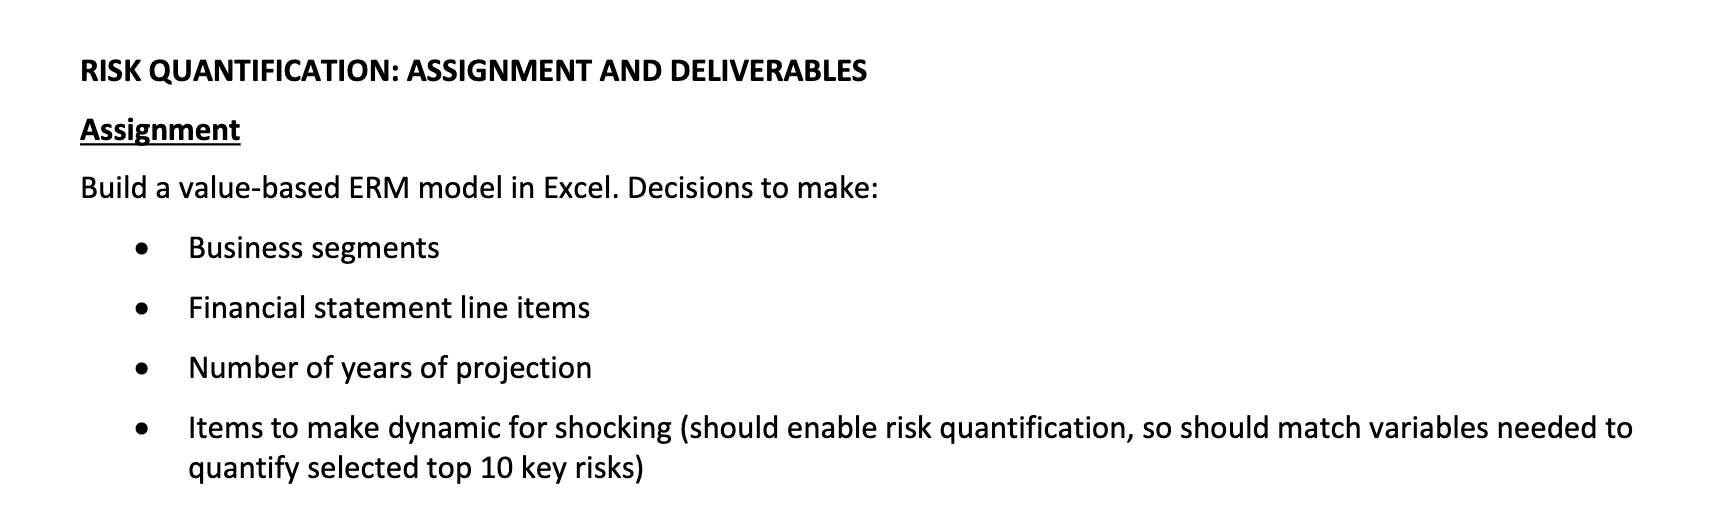
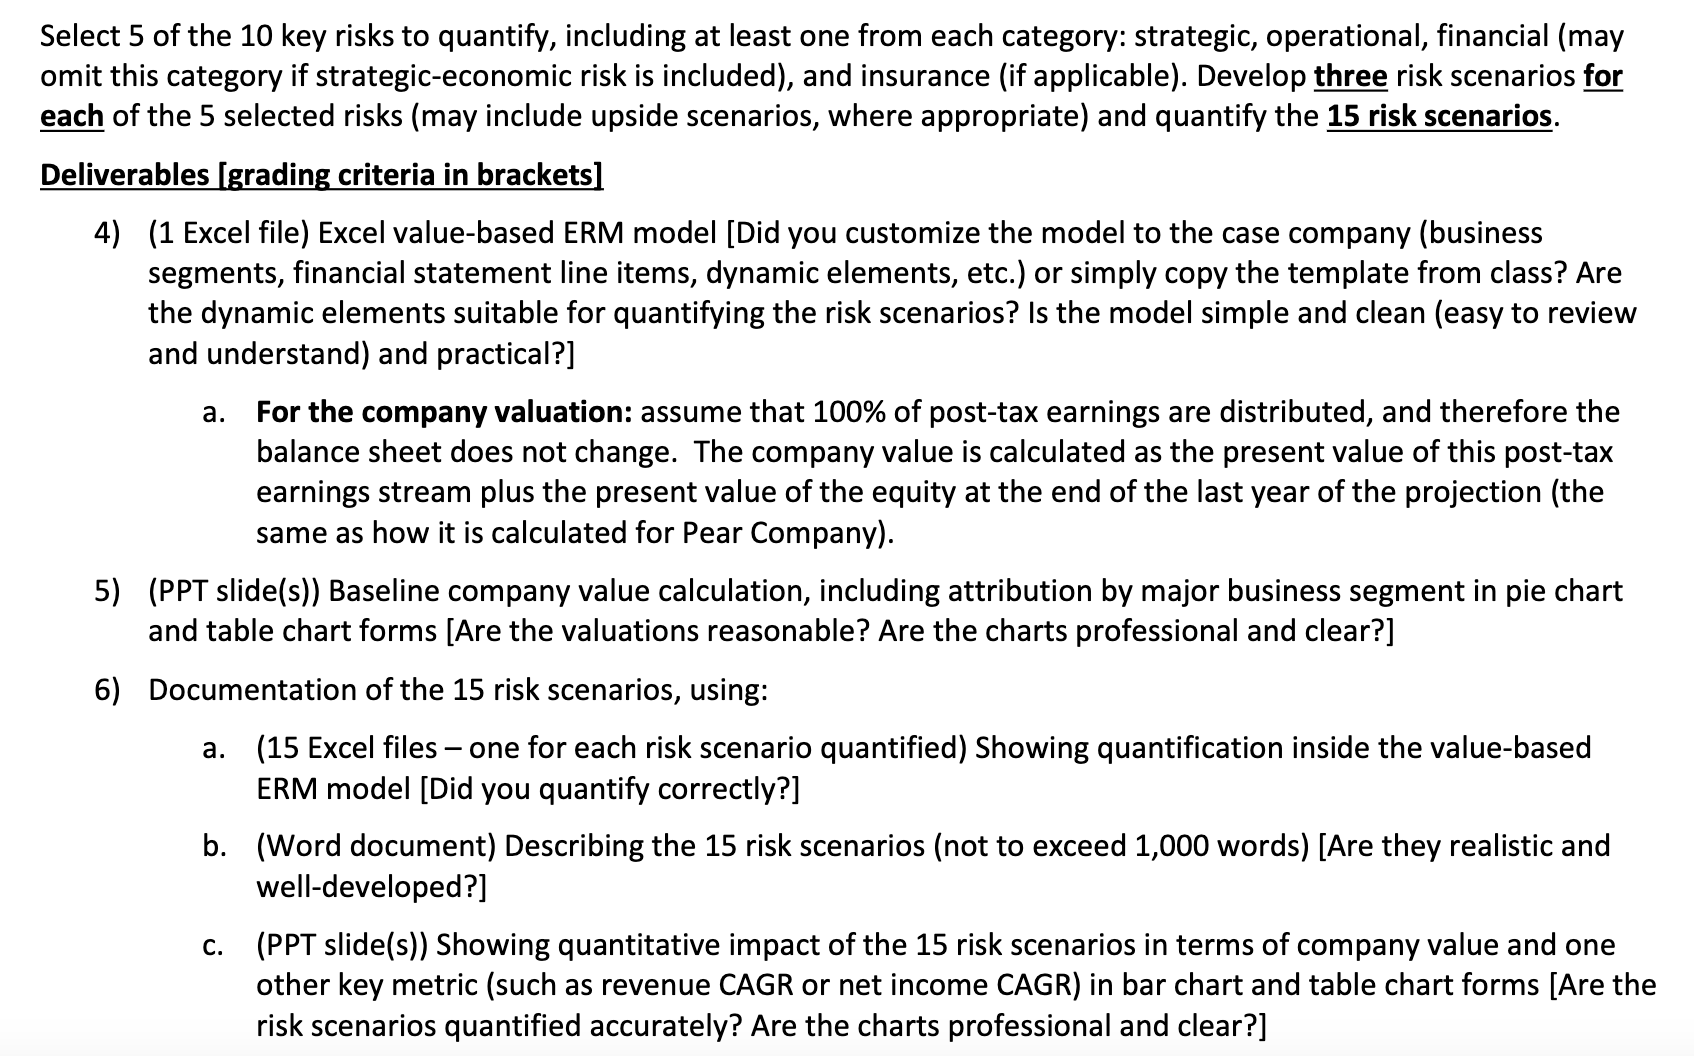
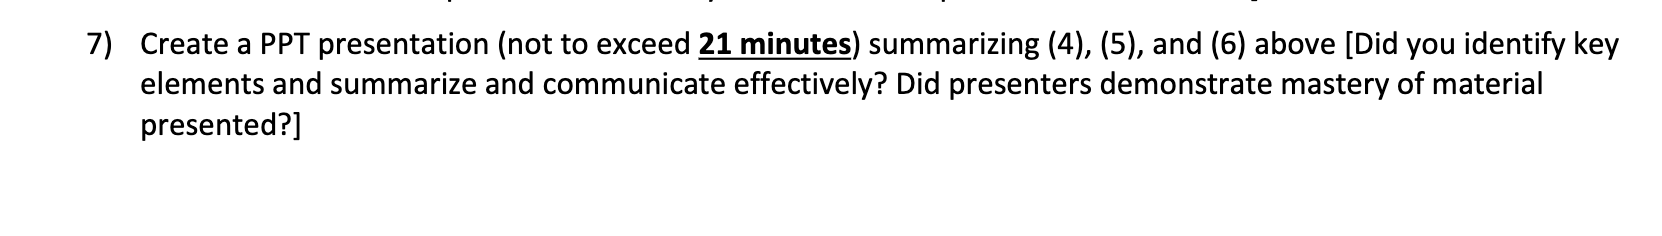
Question: RISK QUANTIFICATION: ASSIGNMENT AND DELIVERABLES Assignment Build a value-based ERM model in Excel. Decisions to make: e Business segments e Financial statement line items e

RISK QUANTIFICATION: ASSIGNMENT AND DELIVERABLESRISK QUANTIFICATION: ASSIGNMENT AND DELIVERABLESRISK QUANTIFICATION: ASSIGNMENT AND DELIVERABLES
RISK QUANTIFICATION: ASSIGNMENT AND DELIVERABLES Assignment Build a value-based ERM model in Excel. Decisions to make: e Business segments e Financial statement line items e Number of years of projection e ltems to make dynamic for shocking (should enable risk quantification, so should match variables needed to quantify selected top 10 key risks) Select 5 of the 10 key risks to quantify, including at least one from each category: strategic, operational, financial (may omit this category if strategic-economic risk is included), and insurance (if applicable). Develop three risk scenarios for each of the 5 selected risks (may include upside scenarios, where appropriate) and quantify the 15 risk scenarios. Deliverables [grading criteria in brackets] 4) 5) 6) (1 Excel file) Excel value-based ERM model [Did you customize the model to the case company (business segments, financial statement line items, dynamic elements, etc.) or simply copy the template from class? Are the dynamic elements suitable for quantifying the risk scenarios? Is the model simple and clean (easy to review and understand) and practical?] a. For the company valuation: assume that 100% of post-tax earnings are distributed, and therefore the balance sheet does not change. The company value is calculated as the present value of this post-tax earnings stream plus the present value of the equity at the end of the last year of the projection (the same as how it is calculated for Pear Companyy). (PPT slide(s)) Baseline company value calculation, including attribution by major business segment in pie chart and table chart forms [Are the valuations reasonable? Are the charts professional and clear?] Documentation of the 15 risk scenarios, using: a. (15 Excel files one for each risk scenario quantified) Showing quantification inside the value-based ERM model [Did you quantify correctly?] b. (Word document) Describing the 15 risk scenarios (not to exceed 1,000 words) [Are they realistic and well-developed?] c. (PPT slide(s)) Showing quantitative impact of the 15 risk scenarios in terms of company value and one other key metric (such as revenue CAGR or net income CAGR) in bar chart and table chart forms [Are the risk scenarios quantified accurately? Are the charts professional and clear?] 7) Create a PPT presentation (not to exceed 21 minutes) summarizing (4), (5), and (6) above [Did you identify key elements and summarize and communicate effectively? Did presenters demonstrate mastery of material presented?]

Step by Step Solution

There are 3 Steps involved in it

1 Expert Approved Answer
Step: 1 Unlock blur-text-image
Question Has Been Solved by an Expert!

Get step-by-step solutions from verified subject matter experts

Step: 2 Unlock
Step: 3 Unlock

Students Have Also Explored These Related Finance Questions!