Question: Risk & Return Assignment Introduction This exercise requires you to perform a series of caleulations using the data contained in the Excel file RiskReturnAssgn.zlsz. The
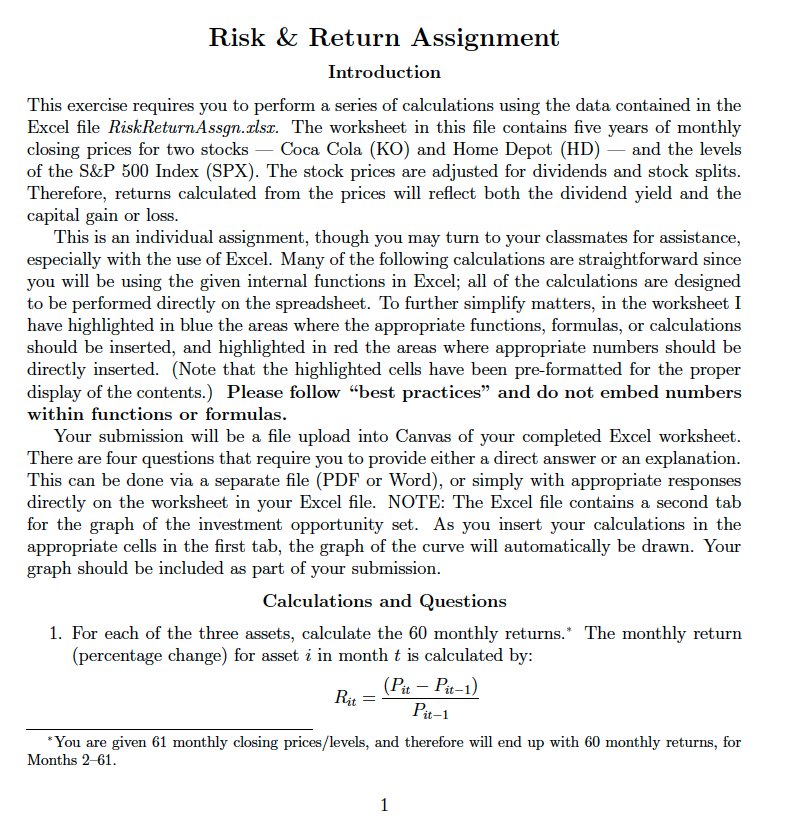
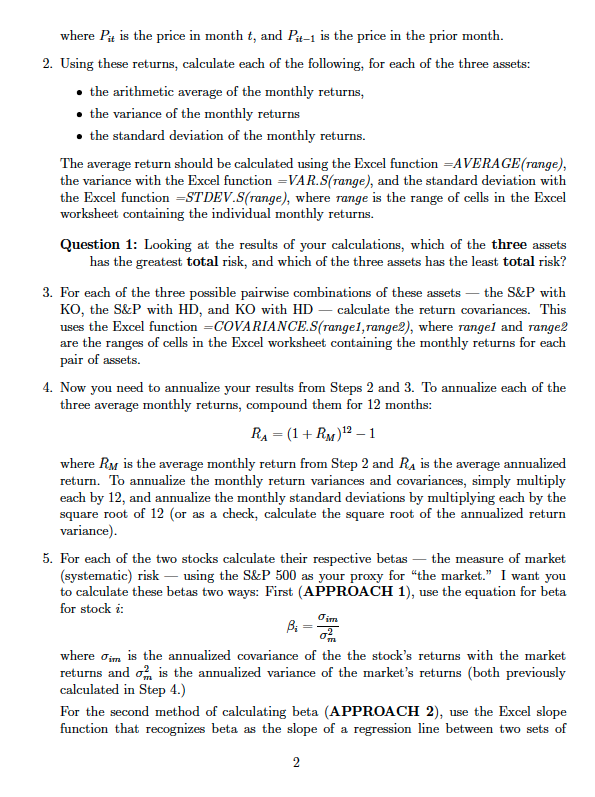
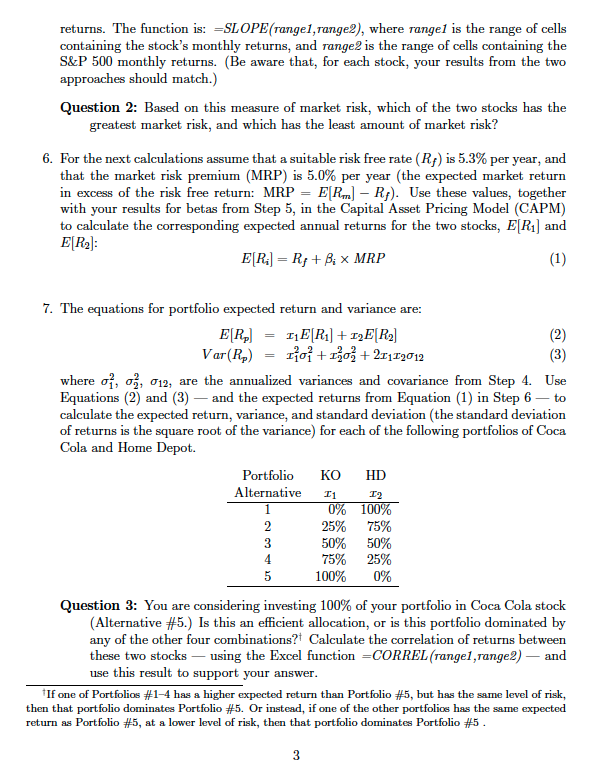
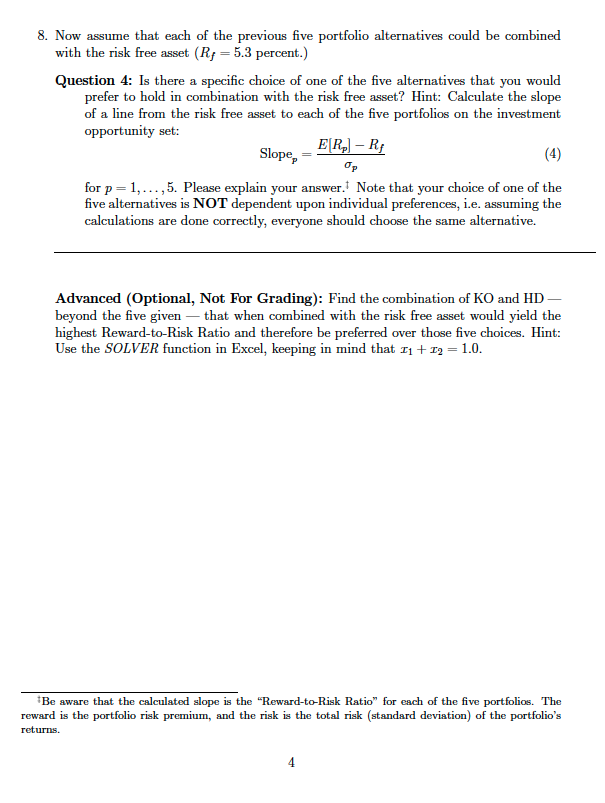
Risk & Return Assignment Introduction This exercise requires you to perform a series of caleulations using the data contained in the Excel file RiskReturnAssgn.zlsz. The worksheet in this file contains five years of monthly closing prices for two stocks Coca Cola (KO) and Home Depot (HD) and the levels of the S&P 500 Index (SPX). The stock prices are adjusted for dividends and stock splits. Therefore, returns calculated from the prices will reflect both the dividend yield and the capital gain or loss. This 1s an individual assignment, though you may turn to your classmates for assistance, especially with the use of Excel. Many of the following calculations are straightforward since you will be using the given internal functions in Excel; all of the calculations are designed to be performed directly on the spreadsheet. To further simplify matters, in the worksheet I have highlighted in blue the areas where the appropriate functions, formulas, or calculations should be inserted, and highlighted in red the areas where appropriate numbers should be directly inserted. (Note that the highlighted cells have been pre-formatted for the proper display of the contents.) Please follow \"best practices\" and do not embed numbers within functions or formulas. Your submission will be a file upload nto Canvas of your completed Excel worksheet. There are four questions that require you to provide either a direct answer or an explanation. This can be done via a separate file (PDF or Word), or simply with appropriate responses directly on the worksheet in your Excel file. NOTE: The Excel file contains a second tab for the praph of the investment opportunmity set. As you msert your calculations in the appropriate cells in the first tab, the graph of the curve will automatically be drawn. Your graph should be included as part of your submission. Calculations and Questions 1. For each of the three assets, calculate the 60 monthly returns.\" The monthly return (percentage change) for asset in month is calculated by: R, = {P:':l; Rizl) it1 *You are given 61 monthly closing prices/levels, and therefore will end up with 60 monthly returns, for Months 2-61. where Fy 15 the price in month , and F;_y 15 the price in the prior month. . Using these returns, calculate each of the following, for each of the three assets: e the anthmetic average of the monthly returns, e the vanance of the monthly returns e the standard deviation of the monthly returns. The average return should be calculated using the Excel function =AVERAGE (range), the variance with the Excel function =VAR.S5{range), and the standard deviation with the Excel function =STDEV S{range), where range 15 the range of cells in the Excel worksheet contaimng the individual monthly returns. Question 1: Looking at the results of your calculations, which of the three assets has the greatest total risk, and which of the three assets has the least total nsk? . For each of the three possible pairwise combinations of these assets the S&P with KO, the S&P with HD, and KO with HD calculate the return covanances. Ths uses the Excel function =COVARIANCE. . S{rangel range?), where rangel and range2 are the ranges of cells in the Excel worksheet containing the monthly returns for each pair of assets. . Now you need to anoualize your results from Steps 2 and 3. To annualize each of the three average monthly returns, compound them for 12 months: R'q. = [1 +RM:|1E 1 where Rjs 1s the average monthly return from Step 2 and R4 1s the average annualized return. To anmualize the monthly return variances and covanances, simply multiply each by 12, and annualize the monthly standard deviations by multiplying each by the square root of 12 (or as a check, calculate the square root of the annualized return variance). . For each of the two stocks calculate their respective betas the measure of market (systematic) nsk using the S&P 500 as your proxy for \"the market.\" [ want you to calculate these betas two ways: First (APPROACH 1), use the equation for beta for stock i: o - % where g, 15 the annualized covanance of the the stock's returns with the market returns and o2, is the annualized variance of the market's returns (both previously calculated in Step 4.) For the second method of calculating beta (APPROACH 2), use the Excel slope function that recogmzes beta as the slope of a regression hne between two sets of 2 returns. The function is: =SLOPE(rangel, range?), where rangel is the range of cells containing the stock's monthly returns, and range? is the range of cells containing the S&P 500 monthly returns. (Be aware that, for each stock, your results from the two approaches should match.) Question 2: Based on this measure of market risk, which of the two stocks has the greatest market risk, and which has the least amount of market risk? 6. For the next calculations assume that a suitable risk free rate (Ry) is 5.3% per year, and that the market risk premium (MRP) is 5.0% per year (the expected market return in excess of the risk free return: MRP = E[Rm] - Ry). Use these values, together with your results for betas from Step 5, in the Capital Asset Pricing Model (CAPM) to calculate the corresponding expected annual returns for the two stocks, E[Ri] and E[R2]: E[Ri] = R/ + B; x MRP (1) 7. The equations for portfolio expected return and variance are: E[RP] = IE[Ri] + 12 E[R2] (2) Var(Rp) = 1joi + 19on + 21112012 (3) where of, 07, 012, are the annualized variances and covariance from Step 4. Use Equations (2) and (3) - and the expected returns from Equation (1) in Step 6 - to calculate the expected return, variance, and standard deviation (the standard deviation of returns is the square root of the variance) for each of the following portfolios of Coca Cola and Home Depot. Portfolio KO HD Alternative I1 0% 100% 25% 75% 50% 50% 75% 25% 100% 0% Question 3: You are considering investing 100% of your portfolio in Coca Cola stock (Alternative #5.) Is this an efficient allocation, or is this portfolio dominated by any of the other four combinations? Calculate the correlation of returns between these two stocks - using the Excel function =CORREL (rangel, range?) - and use this result to support your answer. If one of Portfolios #1-4 has a higher expected return than Portfolio #5, but has the same level of risk, then that portfolio dominates Portfolio #5. Or instead, if one of the other portfolios has the same expected return as Portfolio #5, at a lower level of risk, then that portfolio dominates Portfolio #5 . 38. Now assume that each of the previous five portfolio alternatives could be combined with the nsk free asset (K = 5.3 percent.) Question 4: Is there a specific choice of one of the five alternatives that you would prefer to hold in combination with the nsk free asset? Hint: Calculate the slope of a line from the rsk free asset to each of the five portfolios on the investment opportunity set: E|Ry| Ry . P Slope, = (4) for p=1,...,5. Please explain your answer.! Note that your choice of one of the five alternatives 1s NOT dependent upon individual preferences, 1.e. assumming the calculations are done correctly, everyone should choose the same alternative. Advanced (Optional, Not For Grading): Find the combination of KO and HD beyvond the five given that when combined with the risk free asset would yield the highest Reward-to-Risk Ratio and therefore be preferred over those five choices. Hint: Use the SOLVER function mm Excel, keeping 1n mind that =; + s = 1.0. 'Be aware that the calculated slope 15 the \"Reward-to-Risk Ratio\" for each of the five portfolios. The reward is the portfolio risk premium, and the risk is the total risk (standard deviation) of the portfolio's returns
Step by Step Solution
There are 3 Steps involved in it
1 Expert Approved Answer
Step: 1 Unlock
Question Has Been Solved by an Expert!
Get step-by-step solutions from verified subject matter experts
Step: 2 Unlock
Step: 3 Unlock
Students Have Also Explored These Related Finance Questions!