

Question: Risk-and-Return Examples.xlsx Download Risk-and-Return Examples.xlsxhas, in its Example 1 sheet, the annual returns of the money (T-bill), bond (BofA), and stock (Wilshire) markets, respectively, from
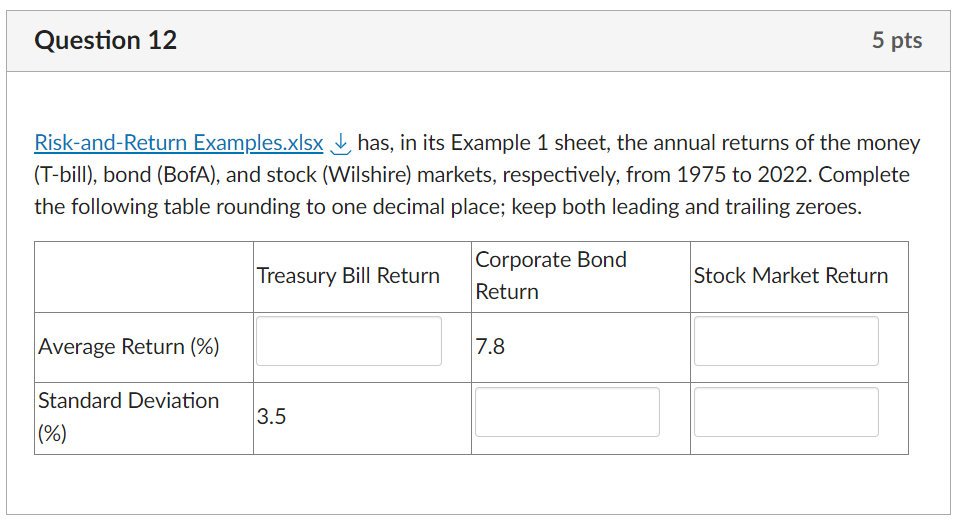
Risk-and-Return Examples.xlsx Download Risk-and-Return Examples.xlsxhas, in its Example 1 sheet, the annual returns of the money (T-bill), bond (BofA), and stock (Wilshire) markets, respectively, from 1975 to 2022. Complete the following table rounding to one decimal place; keep both leading and trailing zeroes.
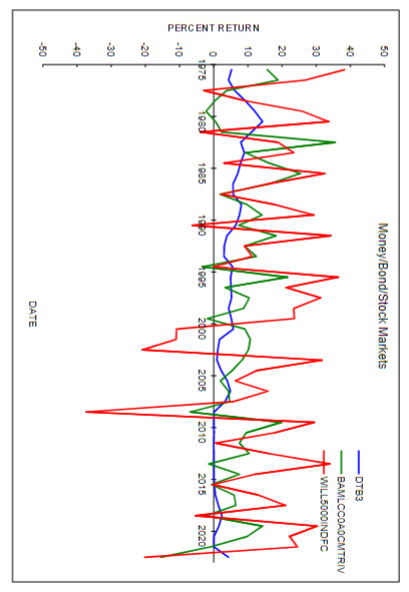
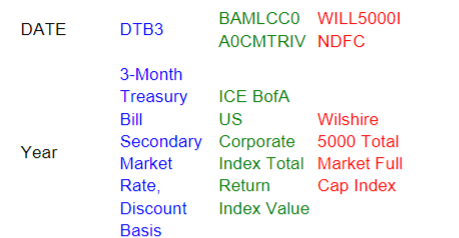
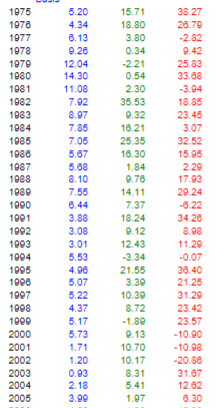
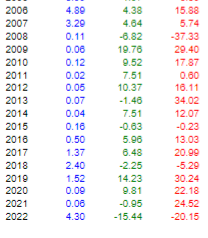
Risk-and-ReturnExamples.xlsx has, in its Example 1 sheet, the annual returns of the money (T-bill), bond (BofA), and stock (Wilshire) markets, respectively, from 1975 to 2022. Complete the following table rounding to one decimal place; keep both leading and trailing zeroes. DATEYearDTB33-MonthTreasuryBillSecondaryMarketRate,DiscountBasisBAMLCC0A0CMTRIVICEBofAUSCorporate5000TotalIndexTotalReturnIndexValueWILL5000INDFCWilshireMarketFullCapIndex 19751976197719781979198019811982198319841985198619871988198919901991199219931994199519961997199819992000200120022003200420055.204.346.139.2612.0414.3011.087.928.977.857.055.675.088.107.556.443.883.083.015.534.965.075.224.375.175.731.711.200.932.183.9915.7118.803.800.342.210.542.3035.539.3216.2125.3516.301.849.7614.117.3718.249.1212.433.3421.553.3910.398.721.899.1310.7010.178.315.411.9738.2726.792.829.4225.8333.683.9418.8523.453.0732.5215.952.2917.9329.246.2234.268.9811.200.0736.4021.2531.2923.4223.5710.9010.9820.8631.6712.626.30 200620072008200920102011201220132014201520162017201820192020202120224.893.290.110.060.120.020.050.070.040.160.501.372.401.520.090.064.304.384.646.8219.769.527.5110.371.467.510.635.966.482.2514.239.810.9515.4415.885.7437.3329.4017.870.6016.1134.0212.070.2313.0320.995.2930.2422.1824.5220.15 Risk-and-ReturnExamples.xlsx has, in its Example 1 sheet, the annual returns of the money (T-bill), bond (BofA), and stock (Wilshire) markets, respectively, from 1975 to 2022. Complete the following table rounding to one decimal place; keep both leading and trailing zeroes. DATEYearDTB33-MonthTreasuryBillSecondaryMarketRate,DiscountBasisBAMLCC0A0CMTRIVICEBofAUSCorporate5000TotalIndexTotalReturnIndexValueWILL5000INDFCWilshireMarketFullCapIndex 19751976197719781979198019811982198319841985198619871988198919901991199219931994199519961997199819992000200120022003200420055.204.346.139.2612.0414.3011.087.928.977.857.055.675.088.107.556.443.883.083.015.534.965.075.224.375.175.731.711.200.932.183.9915.7118.803.800.342.210.542.3035.539.3216.2125.3516.301.849.7614.117.3718.249.1212.433.3421.553.3910.398.721.899.1310.7010.178.315.411.9738.2726.792.829.4225.8333.683.9418.8523.453.0732.5215.952.2917.9329.246.2234.268.9811.200.0736.4021.2531.2923.4223.5710.9010.9820.8631.6712.626.30 200620072008200920102011201220132014201520162017201820192020202120224.893.290.110.060.120.020.050.070.040.160.501.372.401.520.090.064.304.384.646.8219.769.527.5110.371.467.510.635.966.482.2514.239.810.9515.4415.885.7437.3329.4017.870.6016.1134.0212.070.2313.0320.995.2930.2422.1824.5220.15
Step by Step Solution
There are 3 Steps involved in it

Get step-by-step solutions from verified subject matter experts