

Rockboro Machine Tools Corporation 1. What are the implications of different payout levels for Rockboro's capital...
Fantastic news! We've Found the answer you've been seeking!
Question:


Transcribed Image Text:
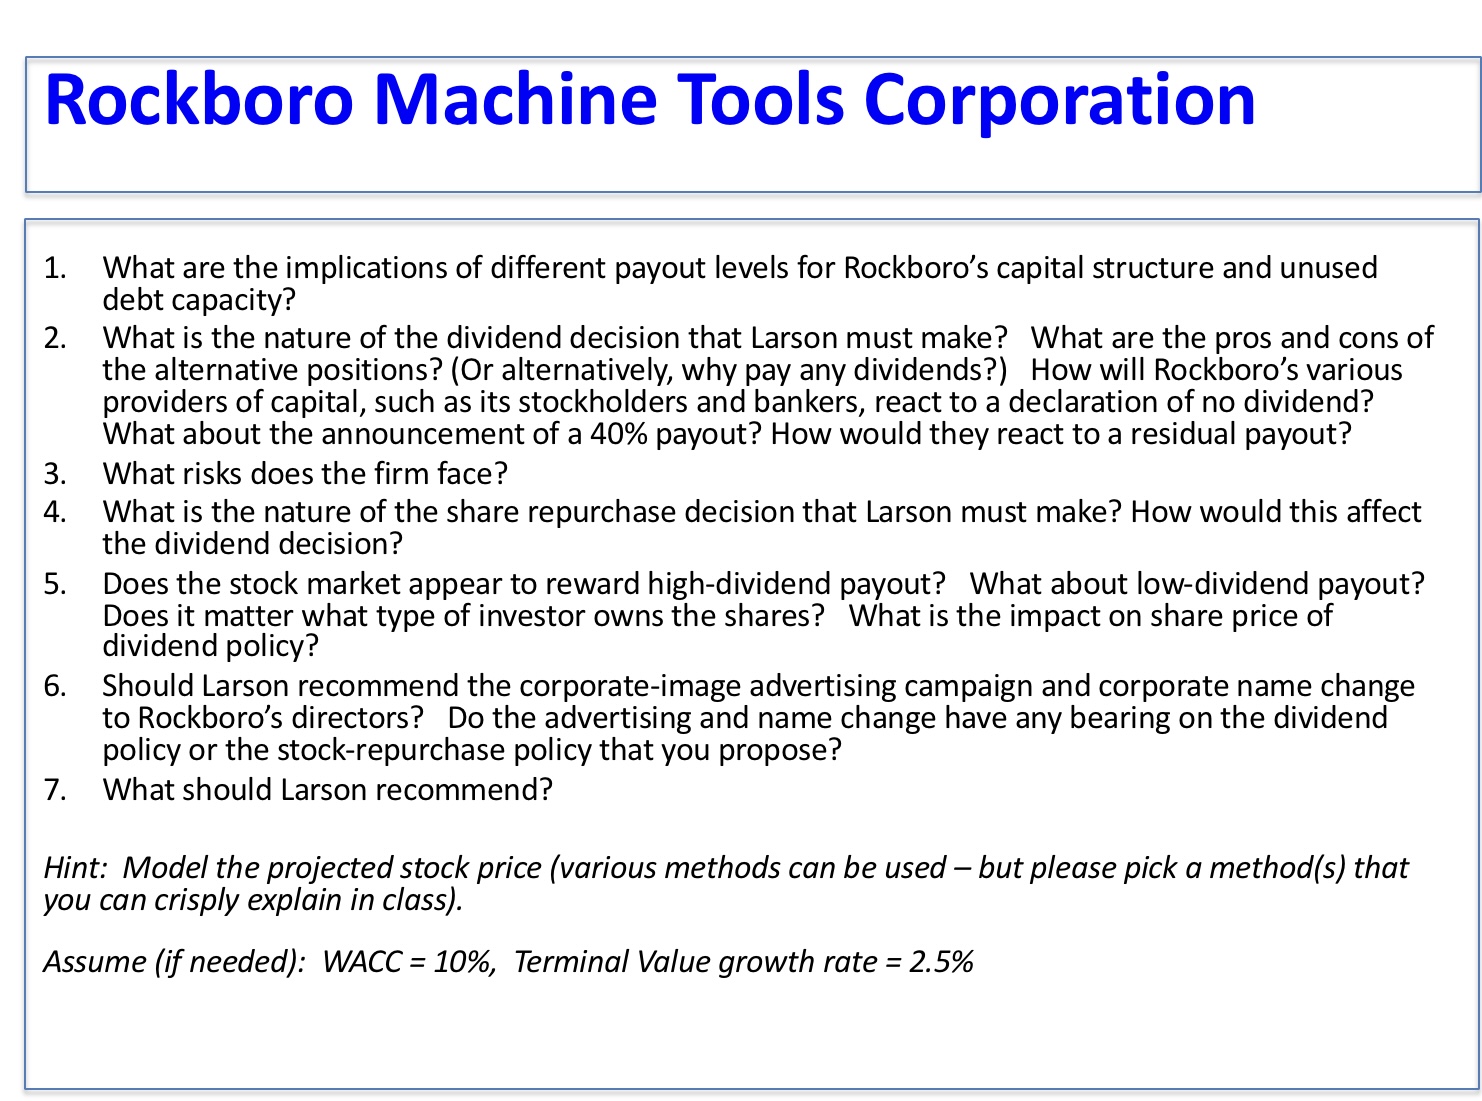
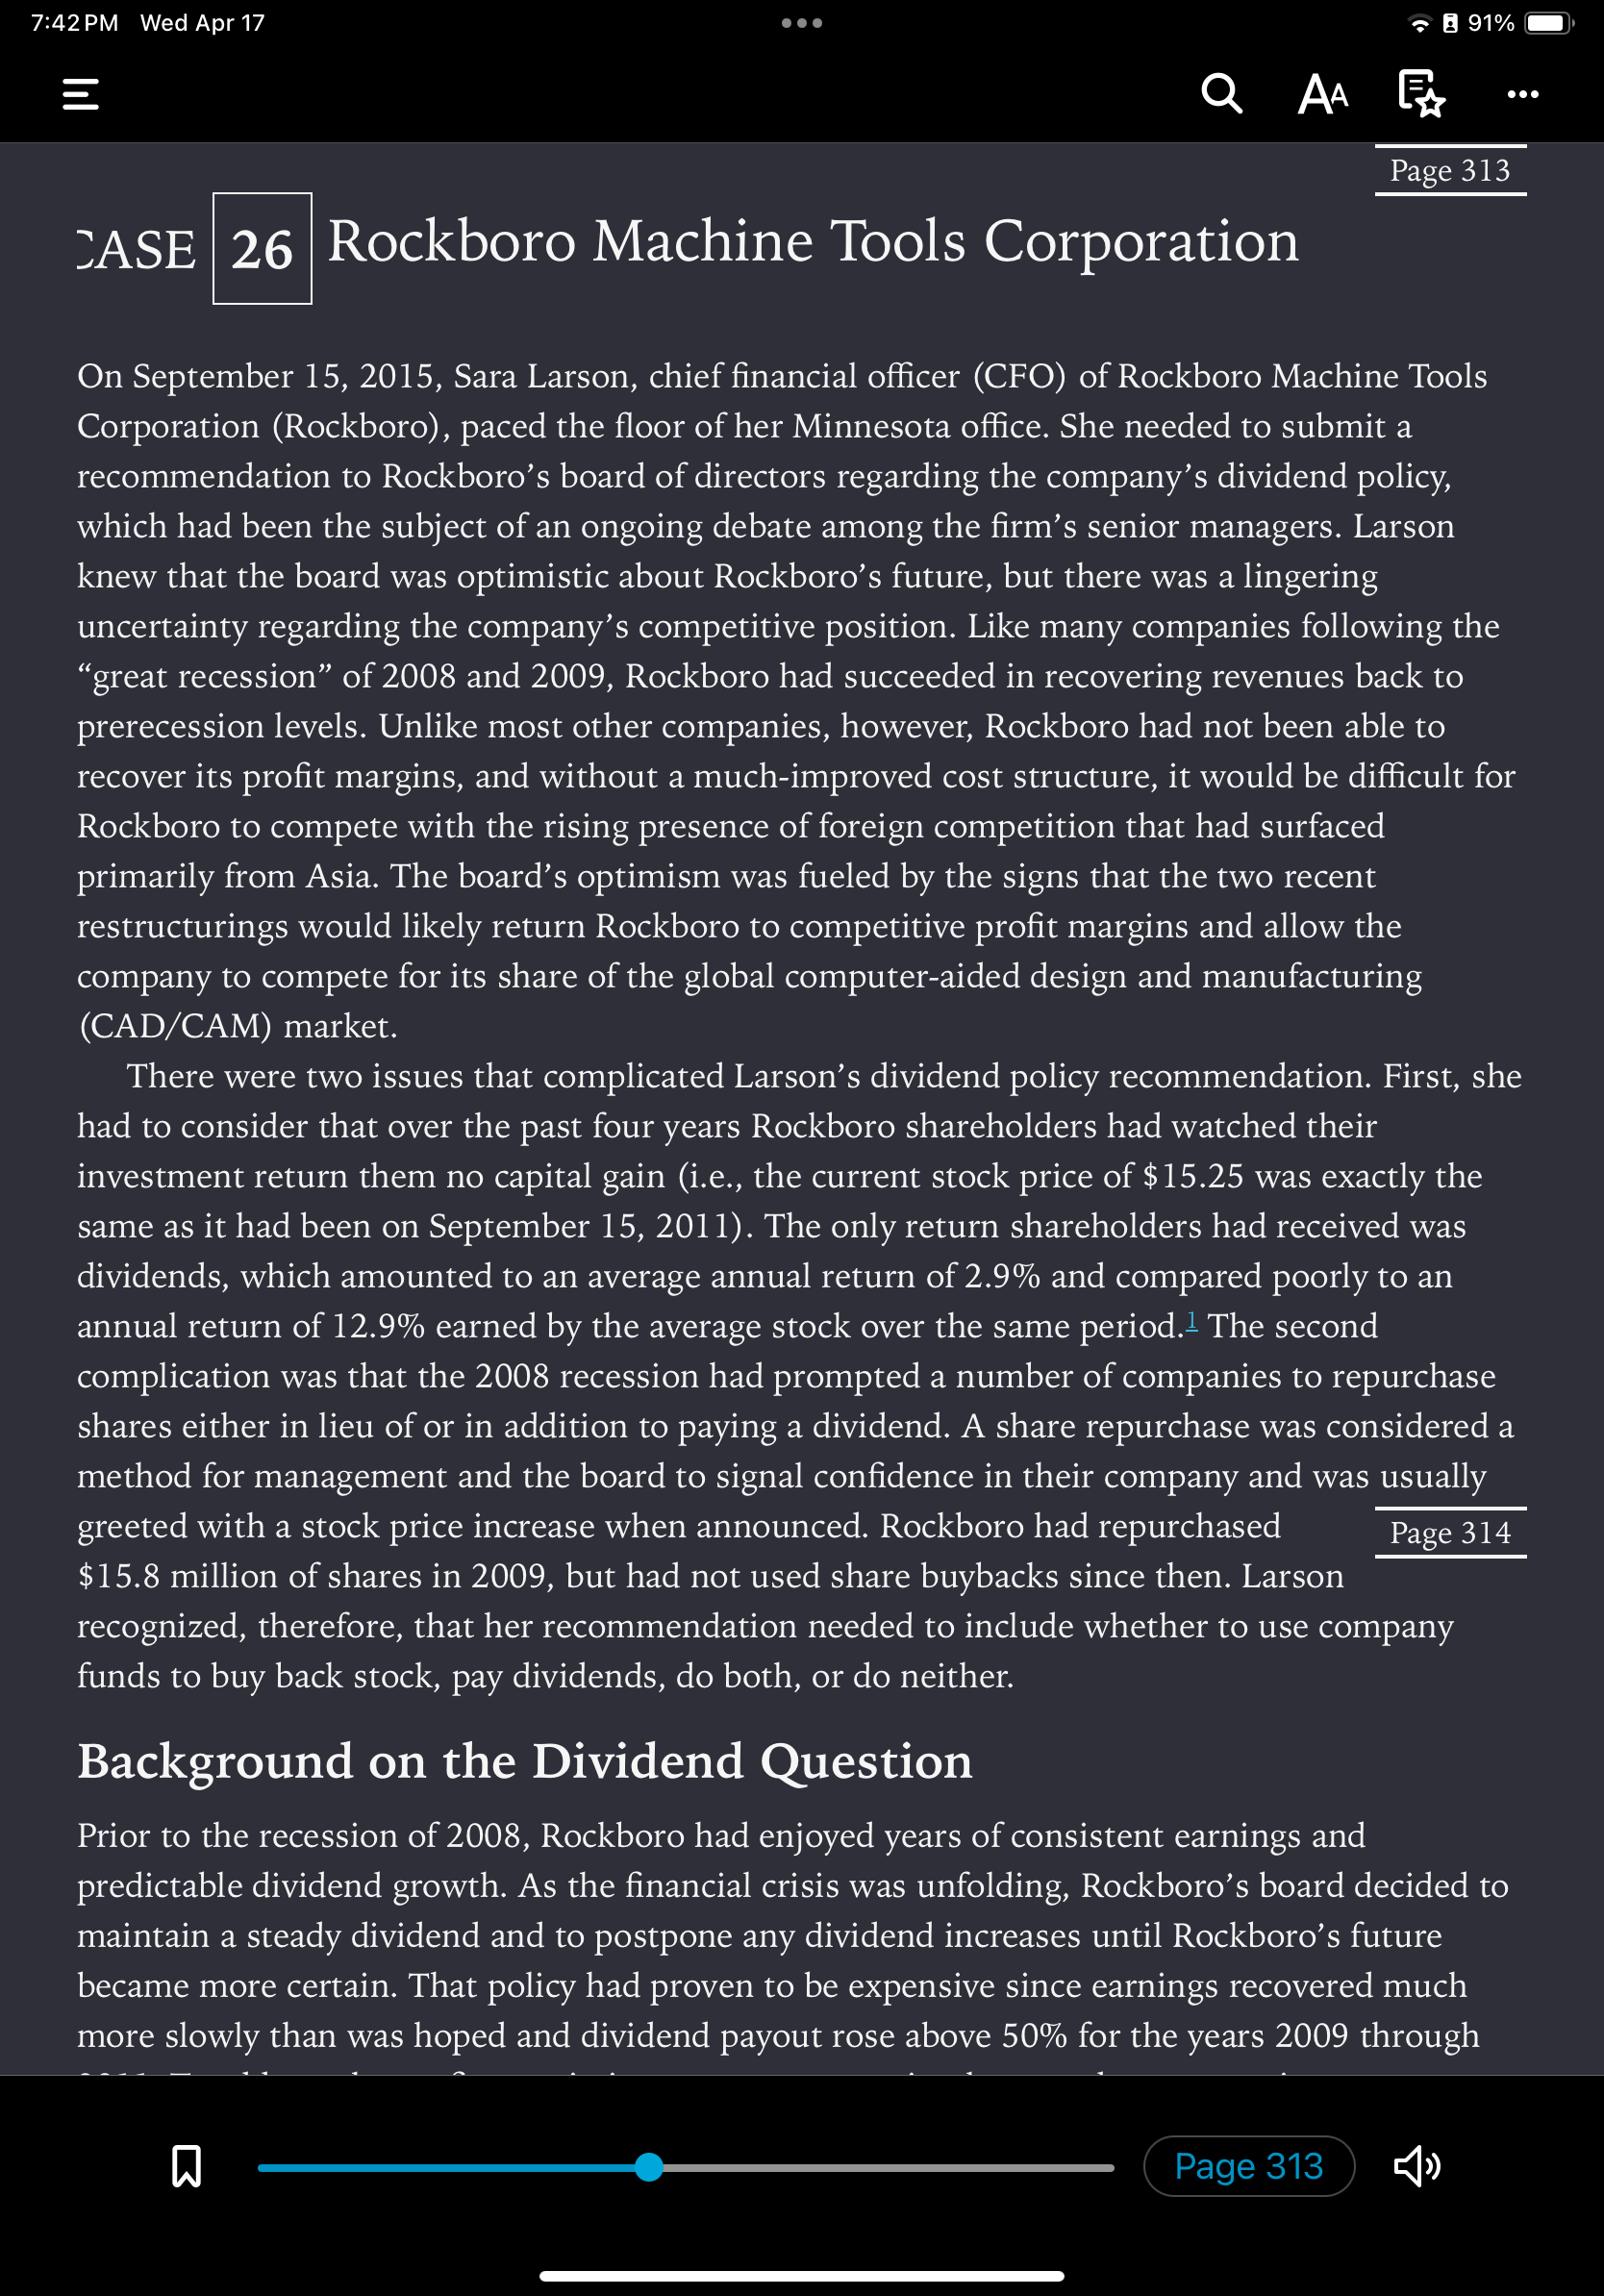
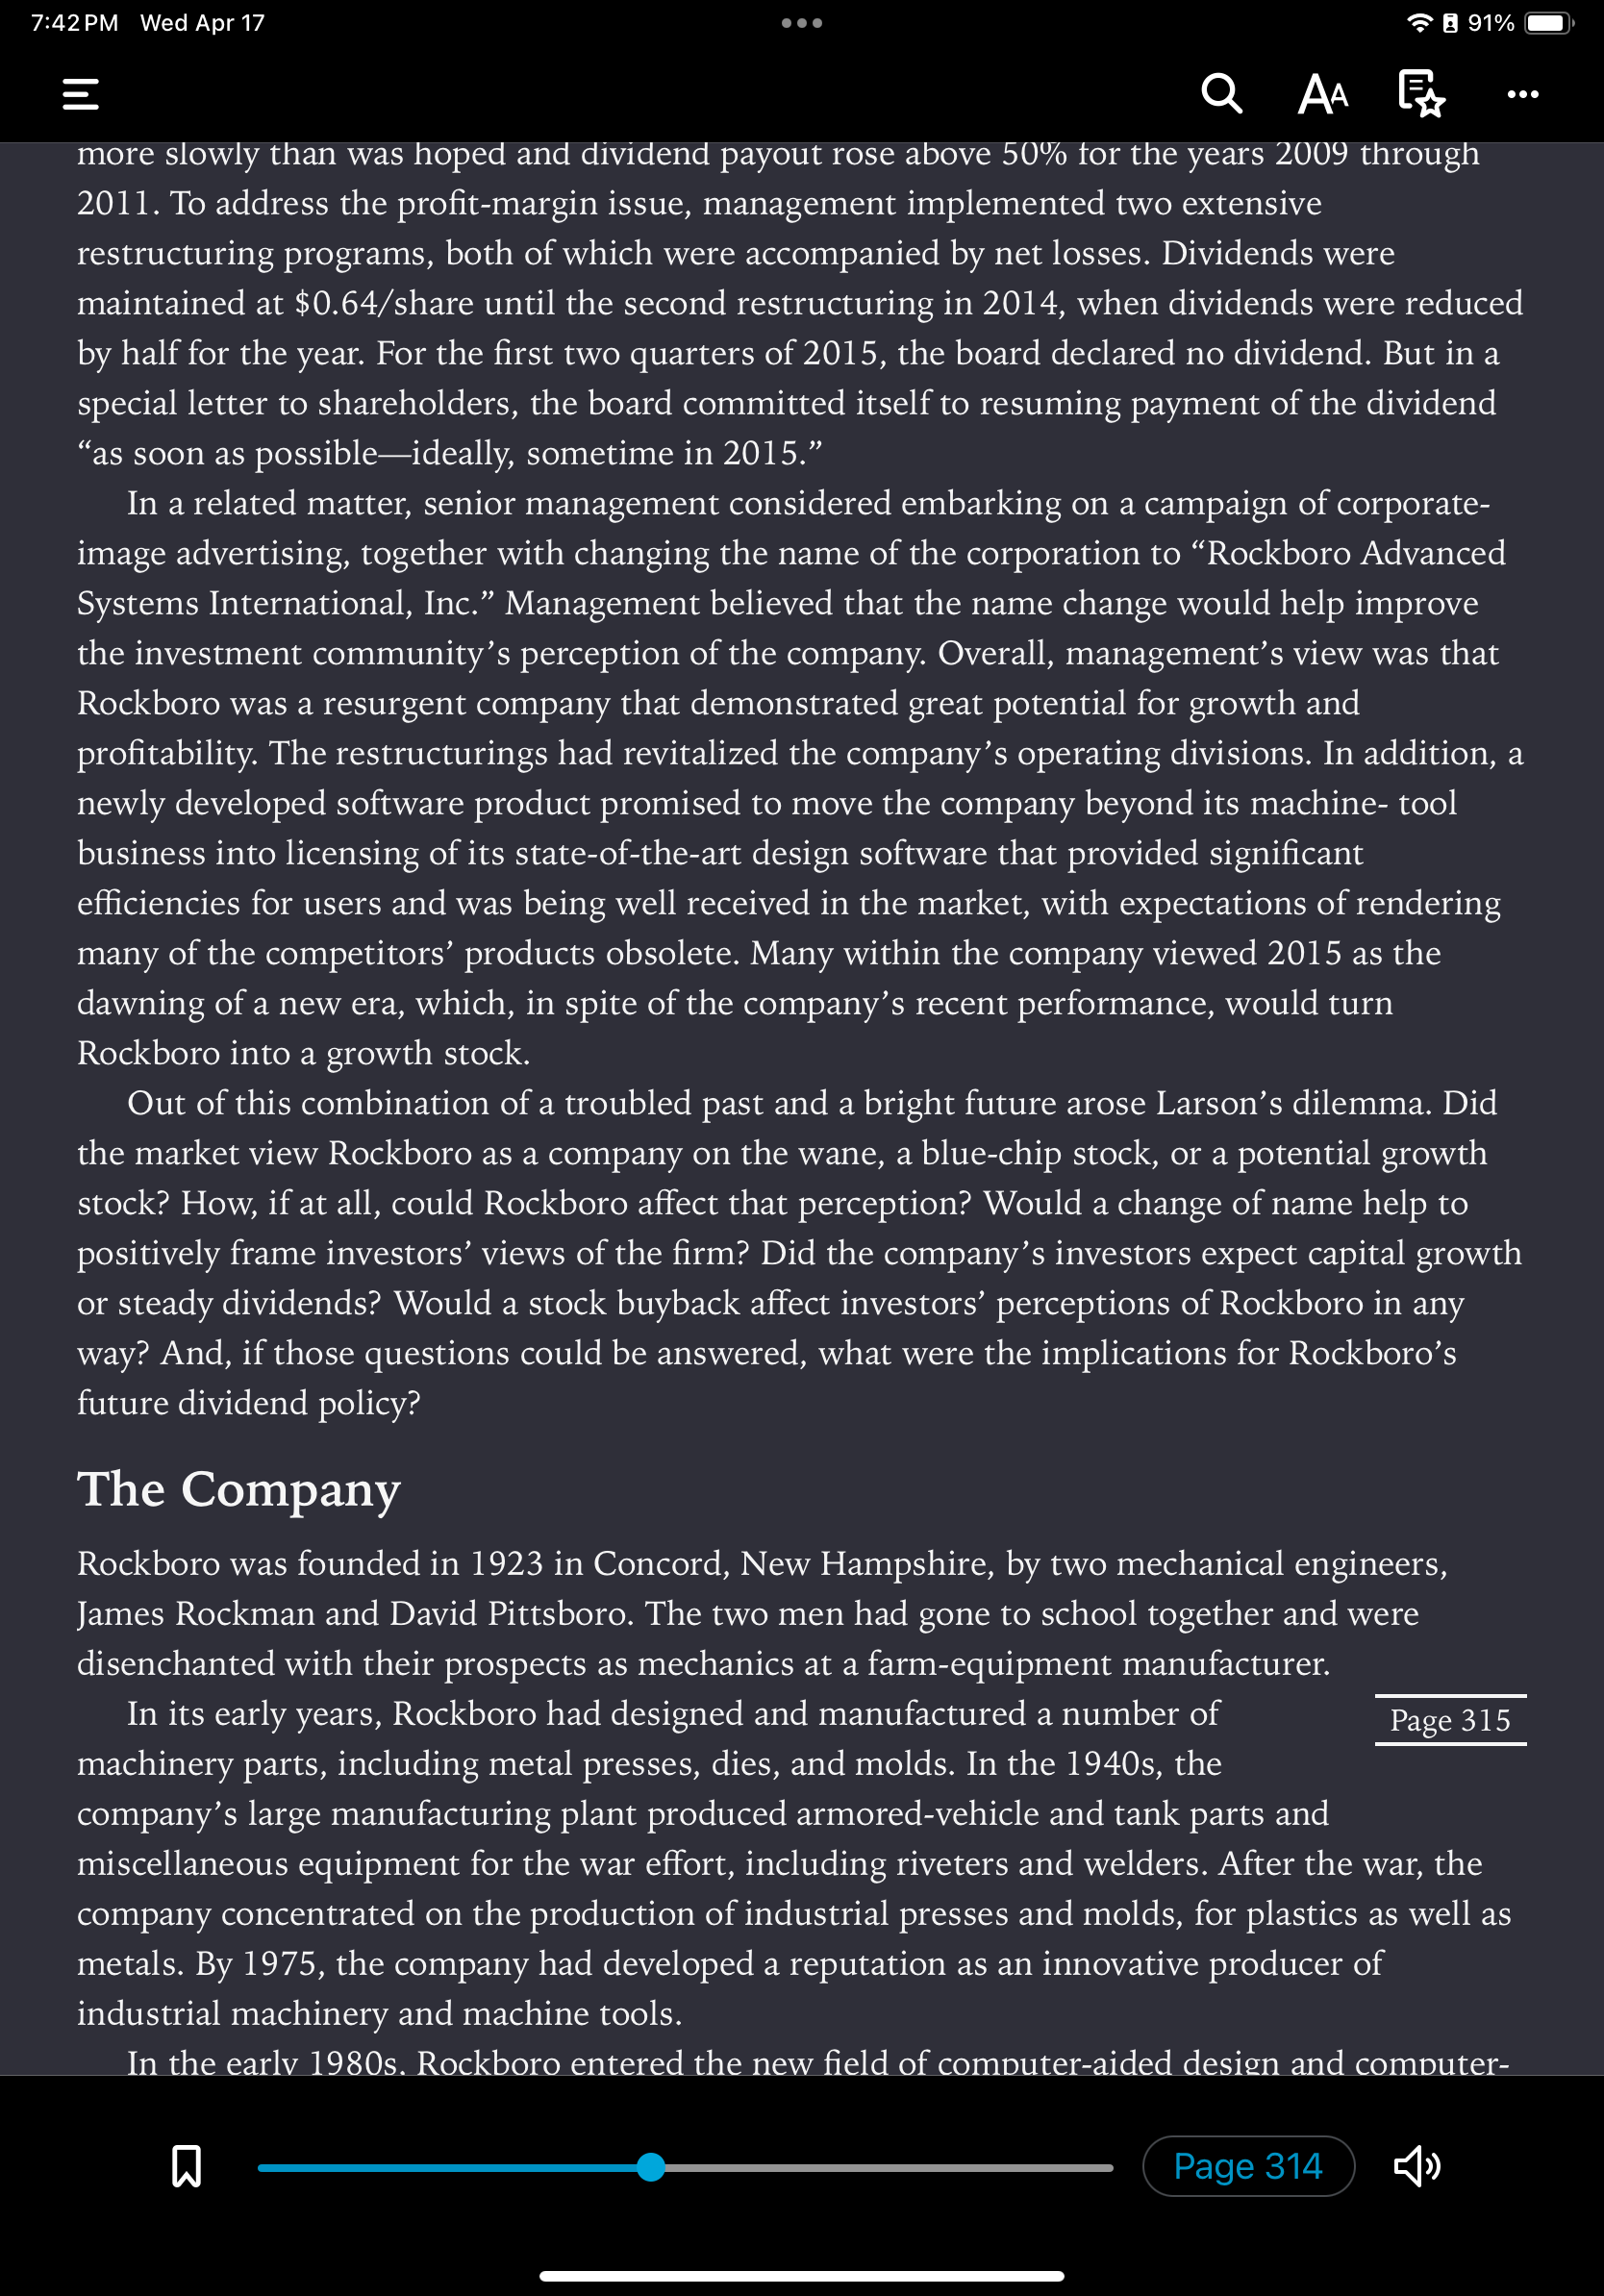
Rockboro Machine Tools Corporation 1. What are the implications of different payout levels for Rockboro's capital structure and unused debt capacity? 2. What is the nature of the dividend decision that Larson must make? What are the pros and cons of the alternative positions? (Or alternatively, why pay any dividends?) How will Rockboro's various providers of capital, such as its stockholders and bankers, react to a declaration of no dividend? What about the announcement of a 40% payout? How would they react to a residual payout? What risks does the firm face? 3. 4. What is the nature of the share repurchase decision that Larson must make? How would this affect the dividend decision? 5. Does the stock market appear to reward high-dividend payout? What about low-dividend payout? Does it matter what type of investor owns the shares? What is the impact on share price of dividend policy? 6. Should Larson recommend the corporate-image advertising campaign and corporate name change to Rockboro's directors? Do the advertising and name change have any bearing on the dividend policy or the stock-repurchase policy that you propose? 7. What should Larson recommend? Hint: Model the projected stock price (various methods can be used - but please pick a method(s) that you can crisply explain in class). Assume (if needed): WACC = 10%, Terminal Value growth rate = 2.5% 7:42 PM Wed Apr 17 = 91% QAA F CASE 26 Rockboro Machine Tools Corporation Page 313 On September 15, 2015, Sara Larson, chief financial officer (CFO) of Rockboro Machine Tools Corporation (Rockboro), paced the floor of her Minnesota office. She needed to submit a recommendation to Rockboro's board of directors regarding the company's dividend policy, which had been the subject of an ongoing debate among the firm's senior managers. Larson knew that the board was optimistic about Rockboro's future, but there was a lingering uncertainty regarding the company's competitive position. Like many companies following the "great recession" of 2008 and 2009, Rockboro had succeeded in recovering revenues back to prerecession levels. Unlike most other companies, however, Rockboro had not been able to recover its profit margins, and without a much-improved cost structure, it would be difficult for Rockboro to compete with the rising presence of foreign competition that had surfaced primarily from Asia. The board's optimism was fueled by the signs that the two recent restructurings would likely return Rockboro to competitive profit margins and allow the company to compete for its share of the global computer-aided design and manufacturing (CAD/CAM) market. There were two issues that complicated Larson's dividend policy recommendation. First, she had to consider that over the past four years Rockboro shareholders had watched their investment return them no capital gain (i.e., the current stock price of $15.25 was exactly the same as it had been on September 15, 2011). The only return shareholders had received was dividends, which amounted to an average annual return of 2.9% and compared poorly to an annual return of 12.9% earned by the average stock over the same period. The second complication was that the 2008 recession had prompted a number of companies to repurchase shares either in lieu of or in addition to paying a dividend. A share repurchase was considered a method for management and the board to signal confidence in their company and was usually greeted with a stock price increase when announced. Rockboro had repurchased $15.8 million of shares in 2009, but had not used share buybacks since then. Larson recognized, therefore, that her recommendation needed to include whether to use company funds to buy back stock, pay dividends, do both, or do neither. Background on the Dividend Question Page 314 Prior to the recession of 2008, Rockboro had enjoyed years of consistent earnings and predictable dividend growth. As the financial crisis was unfolding, Rockboro's board decided to maintain a steady dividend and to postpone any dividend increases until Rockboro's future became more certain. That policy had proven to be expensive since earnings recovered much more slowly than was hoped and dividend payout rose above 50% for the years 2009 through Page 313 7:42 PM Wed Apr 17 = QAA F 891% more slowly than was hoped and dividend payout rose above 50% for the years 2009 through 2011. To address the profit-margin issue, management implemented two extensive restructuring programs, both of which were accompanied by net losses. Dividends were maintained at $0.64/share until the second restructuring in 2014, when dividends were reduced by half for the year. For the first two quarters of 2015, the board declared no dividend. But in a special letter to shareholders, the board committed itself to resuming payment of the dividend "as soon as possible-ideally, sometime in 2015." In a related matter, senior management considered embarking on a campaign of corporate- image advertising, together with changing the name of the corporation to Rockboro Advanced Systems International, Inc. Management believed that the name change would help improve the investment community's perception of the company. Overall, management's view was that Rockboro was a resurgent company that demonstrated great potential for growth and profitability. The restructurings had revitalized the company's operating divisions. In addition, a newly developed software product promised to move the company beyond its machine- tool business into licensing of its state-of-the-art design software that provided significant efficiencies for users and was being well received in the market, with expectations of rendering many of the competitors' products obsolete. Many within the company viewed 2015 as the dawning of a new era, which, in spite of the company's recent performance, would turn Rockboro into a growth stock. Out of this combination of a troubled past and a bright future arose Larson's dilemma. Did the market view Rockboro as a company on the wane, a blue-chip stock, or a potential growth stock? How, if at all, could Rockboro affect that perception? Would a change of name help to positively frame investors' views of the firm? Did the company's investors expect capital growth or steady dividends? Would a stock buyback affect investors' perceptions of Rockboro in any way? And, if those questions could be answered, what were the implications for Rockboro's future dividend policy? The Company Rockboro was founded in 1923 in Concord, New Hampshire, by two mechanical engineers, James Rockman and David Pittsboro. The two men had gone to school together and were disenchanted with their prospects as mechanics at a farm-equipment manufacturer. Page 315 In its early years, Rockboro had designed and manufactured a number of machinery parts, including metal presses, dies, and molds. In the 1940s, the company's large manufacturing plant produced armored-vehicle and tank parts and miscellaneous equipment for the war effort, including riveters and welders. After the war, the company concentrated on the production of industrial presses and molds, for plastics as well as metals. By 1975, the company had developed a reputation as an innovative producer of industrial machinery and machine tools. In the early 1980s. Rockboro entered the new field of computer-aided design and computer- Page 314 7:42 PM Wed Apr 17 = QAA Ex 90% In the early 1980s, Rockboro entered the new field of computer-aided design and computer- aided manufacturing (CAD/CAM). Working with a small software company, it developed a line of presses that could manufacture metal parts by responding to computer commands. Rockboro merged the software company into its operations and, over the next several years, perfected the CAM equipment. At the same time, it developed a superior line of CAD software and equipment that allowed an engineer to design a part to exacting specifications on a computer. The design could then be entered into the company's CAM equipment, and the parts could be manufactured without the use of blueprints or human interference. By the end of 2014, CAD/CAM equipment and software were responsible for about 45% of sales; presses, dies, and molds made up 40% of sales; and miscellaneous machine tools were 15% of sales. Most press-and-mold companies were small local or regional firms with a limited clientele. For that reason, Rockboro stood out as a true industry leader. Within the CAD/CAM industry, however, a number of larger firms, including Autodesk, Inc., Cadence Design, and Synopsys, Inc., competed for dominance of the growing market. Throughout the 1990s and into the first decade of the 2000s, Rockboro helped set the standard for CAD/CAM, but the aggressive entry of large foreign firms into CAD/CAM had dampened sales. Technological advances and significant investments had fueled the entry of highly specialized, state-of-the-art CAD/CAM firms. By 2009, Rockboro had fallen behind its competition in the development of user-friendly software and the integration of design and manufacturing. As a result, revenues had barely recovered beyond the prerecession-level high of $1.07 billion in 2008, to $1.13 billion in 2014, and profit margins were getting compressed because the company was having difficulty containing costs. To combat the weak profit margins, Rockboro took a two-pronged approach. First, a much larger share of the research-and-development budget was devoted to CAD/CAM, in an effort to reestablish Rockboro's leadership in the field. Second, the company underwent two massive restructurings. In 2012, it sold three unprofitable business lines and two plants, eliminated five leased facilities, and reduced personnel. Restructuring costs totaled $98 million. Then, in 2014, the company began a second round of restructuring by refocusing its sales and marketing approach and adopting administrative procedures that allowed for a further reduction in staff and facilities. The total cost of the operational restructuring in 2014 was $134 million. The company's recent financial statements (Exhibits 26.1 and 26.2) revealed that although the restructurings produced losses totaling $303 million, the projected results for 2015 suggested that the restructurings and the increased emphasis on new product development had launched a turnaround. Not only was the company becoming leaner, but also the investment in research and development had led to a breakthrough in Rockboro's CAD/CAM software that management believed would redefine the industry. Known as the Artificial Intelligence Workforce (AIW), the system was an array of advanced control hardware, software, and applications that continuously distributed and coordinated information throughout a plant. Essentially, AIW allowed an engineer to design a part on CAD software and Page 316 Page 315 7:42 PM Wed Apr 17 E QAA F 90% throughout a plant. Essentially, AIW allowed an engineer to design a part on CAD software and input the data into CAM equipment that controlled the mixing of chemicals or the molding of parts from any number of different materials on different machines. The system could also assemble and can, box, or shrink-wrap the finished product. As part of the licensing agreements for the software, Rockboro engineers provided consulting to specifically adapt the software to each client's needs. Thus regardless of its complexity, a product could be designed, manufactured, and packaged solely by computer. Most importantly, however, Rockboro's software used simulations to test new product designs prior to production. This capability was enhanced by the software's capability to improve the design based on statistical inferences drawn from Rockboro's large proprietary database. EXHIBIT 26.1 I Consolidated Income Statements (dollars in thousands, except per-share data) Projected 2012 2013 2014 2015 Net sales Cost of sales Gross profit $1,287,394 $1,223,969 $1,134,956 $1,305,000 811,121 752,186 748,319 824,625 476,273 471,782 386,638 480,375 Research and development 116,516 105,818 113,126 115,875 Selling, general, and administrative 344,957 335,450 346,511 317,250 Restructuring costs 98,172 0 134,116 Operating profit (loss) (83,372) 30,515 (207,115) 47,250 Other income (expense) (6,750) 1,598 (5,186) (6,300) Income (loss) before taxes (90,122) 32,112 (212,301) 40,950 Income taxes (benefit) 1,861 12,623 (1,125) 13,923 Net income (loss) ($91,982) $ 19,490 ($211,176) $ 27,027 Earnings (loss) per share ($3.25) $ 0.69 ($7.57) $ 0.98 Dividends per share 0.64 $ 0.64 $ 0.32 $ 0.39 Note: The dividends in 2015 assume a payout ratio of 40%. Source: Author estimates. EXHIBIT 26.2 | Consolidated Balance Sheets (dollars in thousands) 2013 2014 Projected 2015 Cash and equivalents $ 20,876 $ 33,345 $ 38,498 Accounts receivable 312,812 280,853 326,265 Inventories 345,513 305,832 325,832 Prepaid expenses 21,389 19,524 22,517 Other 33,276 31,071 31,500 Total current assets 733,865 670,625 744,611 Property, plant, and equipment 491,405 538,262 616,482 Less depreciation 251,121 275,229 308,295 Net property, plant, and equipment 240,284 263,033 308,187 Intangible assets 14,144 Other assets 23,585 3,149 26,532 Total assets $1,011,876 $963,338 Bank loans $ 51,294 $107,018 Accounts payable Current portion of long-term debt Accruals and other 54,674 450 194,061 51,359 225 2,273 26,954 $1,082,024 $ 112,472 56,291 2,273 242,450 Total current liabilities 300,479 401,051 274,521 445,556 Page 316 7:43 PM Wed Apr 17 EXHIBIT 26.2 I Consolidated Balance Sheets (dollars in thousands) QAA F 90% Projected 2013 2014 2015 Cash and equivalents $ Accounts receivable Inventories 20,876 312,812 $ 33,345 $ 38,498 280,853 326,265 345,513 305,832 325,832 Prepaid expenses Other 21,389 19,524 22,517 33,276 31,071 31,500 Total current assets 733,865 670,625 744,611 Property, plant, and equipment 491,405 538,262 616,482 Less depreciation 251,121 275,229 308,295 Net property, plant, and equipment 240,284 263,033 308,187 Intangible assets 14,144 3,149 2,273 Other assets 23,585 26,532 26,954 Total assets $1,011,876 $963,338 Bank loans $ 51,294 $107,018 Accounts payable 54,674 Current portion of long-term debt 450 51,359 225 $1,082,024 $ 112,472 56,291 2,273 Accruals and other 194,061 242,450 274,521 Total current liabilities 300,479 401,051 445,556 Deferred taxes 25,479 20,654 24,789 Long-term debt 13,500 13,163 45,032 Deferred pension costs 67,185 96,488 105,240 Other liabilities 3,477 8,166 11,258 Total liabilities 410,120 539,520 631,874 Common stock, $1 par value 28,283 28,283 28,253 Capital in excess of par 161,811 161,861 161,834 Cumulative translation adjustment (9,849) 30,312 40,485 Retained earnings 437,247 219,098 235,313 Less treasury stock at cost: (15,735) (15,735) (15,735) Total shareholders' equity Total liabilities and equity 601,757 $1,011,876 423,818 450,149 $963,338 $1,082,022 Note: Projections assume a dividend-payout ratio of 40%. Source: Author estimates. Rockboro had developed AIW applications for the chemicals industry and for the oil- and gas-refining industries in 2014 and, by the next year, it would complete applications for the trucking, automobile-parts, and airline industries. By October 2014, when the first AIW system was shipped, Rockboro had orders totaling $115 million. By year-end 2014, the backlog had grown to $150 million. The future for the product looked bright. Several securities analysts were optimistic about the product's impact on the company. The following comments paraphrase their thoughts: The Artificial Intelligence Workforce system has compelling advantages over competing entries, which will enable Rockboro to increase its share of a market that, ignoring periodic growth spurts, will expand at a real annual rate of about 5% over the next several years. Rockboro's engineering team is producing the AIW applications at an impressive rate, which will help restore margins to levels not seen in years. The important question now is how quickly Rockboro will be able to sell licenses in volume. Start-up costs, which were a significant factor in last year's deficits, have continued to penalize Page 316 * 7:43 PM Wed Apr 17 E 90% QAA F Start-up costs, which were a significant factor in last year's deficits, have continued to penalize earnings. Our estimates assume that adoption rates will proceed smoothly from now on and that AIW will have gained significant market share by year-end 2016. Rockboro's management expected domestic revenues from the Artificial Intelligence Workforce series to total $135 million in 2015 and $225 million in 2016. Thereafter, growth in sales would depend on the development of more system applications and the creation of system improvements and add-on features. International sales through Rockboro's existing offices in Frankfurt, London, Milan, and Paris and new offices in Hong Kong, Shanghai, Seoul, Manila, and Tokyo were expected to help meet foreign competition head on and to provide additional revenues of $225 million by as early as 2017. Currently, international sales accounted for approximately 15% of total corporate revenues. Page 317 Two factors that could affect sales were of some concern to management. First, although Rockboro had successfully patented several of the processes used by the AIW system, management had received hints through industry observers that two strong competitors were developing comparable systems and would probably introduce them within the next 12 months. Second, sales of molds, presses, machine tools, and CAD/CAM equipment and software were highly cyclical, and current predictions about the strength of the United States and other major economies were not encouraging. As shown in Exhibit 26.3, real GDP (gross domestic product) growth was expected to expand to 2.9% by 2016, and industrial production, which had improved significantly for 2014 to 4.2% growth, was projected to decline in 2015 before recovering to 3.6% by 2016. Despite the lukewarm macroeconomic environment, Rockboro's management remained optimistic about the company's prospects because of the successful introduction of the AIW series. EXHIBIT 26.3 I Economic Indicators and Projections (all numbers are percentages) Projected 2011 2012 2013 2014 2015 2016 Three-month Treasury bill rate 0.1% 0.1% 0.1% 0.1% 0.3% 1.2% 10-year Treasury note yield 2.8% 1.8% 2.4% 2.5% 2.2% 2.9% AAA corporate bond rate 4.6% 3.7% 4.2% 4.2% 3.8% 4.6% Percent change in: Real gross domestic product 1.6% 2.3% 2.2% 2.4% 2.3% 2.9% Industrial production 3.3% 3.8% 2.9% 4.2% 0.5% 3.6% Consumer price index 3.1% 2.1% 1.5% 1.6% 0.3% 2.2% Data source: "Value Line Investment Survey," August 2015. Corporate Goals A number of corporate objectives had grown out of the restructurings and recent technological advances. First and foremost, management wanted and expected revenues to grow at an average annual compound rate of 15%. With the improved cost structure, profit growth was expected to in line mouth dool of inch dhoon dossated Page 316 7:43 PM Wed Apr 17 = QAA E 90% annual compound rate of 15%. With the improved cost structure, profit growth was expected to exceed top-line growth. A great deal of corporate planning had been devoted to the growth goal over the past three years and, indeed, second-quarter financial data suggested that Rockboro would achieve revenues of about $1.3 billion in 2015. If Rockboro achieved a 15% compound rate of revenue growth through 2021, the company would reach $3.0 billion in sales and $196 million in net income. In order to achieve their growth objective, Rockboro management proposed a strategy relying on three key points. First, the mix of production would shift substantially. CAD/CAM with emphasis on the AIW system would account for three-quarters of sales, while the company's traditional presses and molds would account for the remainder. Second, the company would expand aggressively in the global markets, where it hoped to obtain half of its sales and profits by 2021. This expansion would be achieved through opening new field sales offices around the world, including Hong Kong, Shanghai, Seoul, Manila, and Tokyo. Third, the company would expand through joint ventures and acquisitions of small software companies, which would provide half of the new products through 2021; in-house research would provide the other half. The company had had an aversion to debt since its inception. Management believed that a small amount of debt, primarily to meet working-capital needs, had its place, but anything beyond a 40% debt-to-equity ratio was, in the oft-quoted words of Rockboro cofounder David Pittsboro, unthinkable, indicative of sloppy management, and flirting with trouble. Senior management was aware that equity was typically more costly than debt, but took great satisfaction in the company doing it on its own." Rockboro's highest debt-to-capital ratio in the past 25 years (28%) had occurred in 2014 and was still the subject of conversations among senior managers. Although 11 members of the Rockman and the Pittsboro families owned 13% of the company's stock and three were on the board of directors, management placed the interests of the outside shareholders first (Exhibit 26.4). Stephen Rockman, board chair and grandson of the cofounder, sought to maximize growth in the market value of the company's stock over time. At 61, Rockman was actively involved in all aspects of the company's growth. He dealt fluently with a range of technical details of Rockboro's products and was especially interested in finding ways to improve the company's domestic market share. His retirement was no Page 318 more than four years away, and he wanted to leave a legacy of corporate financial strength and technological achievement. The Artificial Intelligence Workforce, a project that he had taken under his wing four years earlier, was finally beginning to bear fruit. Rockman now wanted to ensure that the firm would also soon be able to pay a dividend to its shareholders. EXHIBIT 26.4 I Comparative Stockholder Data, 2004 and 2014 (in thousands of shares) 2014 Shares 2004 Percentage Shares Percentage Page 317 7:43 PM Wed Apr 17 EXHIBIT 26.4 I Comparative Stockholder Data, 2004 and 2014 (in thousands of shares) 2014 QAA Ex 2004 Shares Percentage Shares Percentage Founders' families 3,585 13% 5,113 18% Employees and families 5,516 20% 4,443 16% Institutional investors Growth oriented 3,585 13% 1,602 6% Value oriented 2,207 8% 3,409 12% Individual investors Long term; retirement 10,205 37% 6,767 24% Short term; trading oriented Other; unknown 1,379 5% 3,409 12% 1,103 4% 3,153 11% Total 27,578 100% 27,896 100% Note: The investor-relations department identified these categories from company records. The type of institutional investor was identified from promotional materials stating the investment goals of the institutions. The type of individual investor was identified from a survey of subsamples of investors. Source: Author estimates. Rockman took particular pride in selecting and developing promising young managers. Sara Larson had a bachelor's degree in electrical engineering and had been a systems analyst for Motorola before attending graduate school. She had been hired in 2005, fresh out of a well- known MBA program. By 2014, she had risen to the position of CFO. Dividend Policy Before 2009, Rockboro's earnings and dividends per share had grown at a relatively steady pace (Exhibit 26.5). Following the recession, cost-control problems became apparent because earnings were not able to rebound to prerecession levels. The board maintained dividends at $0.64 per year until 2014 when the restructuring expenses led to the largest per-share earnings loss in the firm's history. To conserve cash, the board voted to pare back dividends by 50% to $0.32 a sharethe lowest dividend since 1998. Paying any dividend with such high losses effectively meant that Rockboro had to borrow to pay the dividend. In response to the financial pressure, the directors elected to not declare a dividend for the first two quarters of 2015. In a special letter to shareholders, however, the directors declared their intention to continue the annual payout later in 2015. EXHIBIT 26.5 I Per-Share Financial and Stock Data1 Stock price Year Sales/ share Avg. Payout Avg. EPS2 DPS2 CPS2 High Low Avg. P/E ratio yield Shares outstanding (millions) 2000 $16.12 $1.19 $0.37 $2.03 $21.11 2001 15.00 1.28 0.39 2.14 21.23 $10.18 8.20 $14.85 12.5 31% 2.5% 23.4 13.50 10.5 30% 2.9% 24.1 2002 15.23 0.45 0.40 1.17 18.50 10.18 13.35 29.8 88% 3.0% 26.8 2003 16.37 0.86 0.42 1.65 22.48 12.17 18.36 21.4 48% 2.3% 27.1 2004 21.08 1.27 0.45 2.13 23.84 18.01 21.00 16.5 35% 2.1% 27.6 2005 24.93 1.90 0.47 2.86 26.70 18.25 22.73 11.9 25% 2.1% 28.0 2006 30.10 2.67 0.51 3.75 34.34 22.75 30.31 11.3 19% 1.7% 28.1 2007 34.59 3.07 0.59 4.22 44.13 32.66 38.29 12.5 19% 1.5% 28.2 2008 37.80 3.24 0.64 4.41 46.73 20.81 36.58 11.3 20% 1.7% 28.3 Page 318 90% 7:43 PM Wed Apr 17 EXHIBIT 26.5 I Per-Share Financial and Stock Data1 Stock price QAA EX 90% Year Sales/ share Avg. Payout Avg. Shares outstanding EPS DPS2 CPS2 High Low Avg. P/E ratio yield (millions) 2000 $16.12 $1.19 $0.37 $2.03 $21.11 $10.18 $14.85 12.5 31% 2.5% 23.4 2001 15.00 1.28 0.39 2.14 21.23 8.20 13.50 10.5 30% 2.9% 24.1 2002 15.23 0.45 0.40 1.17 18.50 10.18 13.35 29.8 88% 3.0% 26.8 2003 16.37 0.86 0.42 1.65 22.48 12.17 18.36 21.4 48% 2.3% 27.1 2004 21.08 1.27 0.45 2.13 23.84 18.01 21.00 16.5 35% 2.1% 27.6 2005 24.93 1.90 0.47 2.86 26.70 18.25 22.73 11.9 25% 2.1% 28.0 2006 30.10 2.67 0.51 3.75 34.34 22.75 30.31 11.3 19% 1.7% 28.1 2007 34.59 3.07 0.59 4.22 44.13 32.66 38.29 12.5 19% 1.5% 28.2 2008 37.80 3.24 0.64 4.41 46.73 20.81 36.58 11.3 20% 1.7% 28.3 2009 26.61 0.75 0.64 1.52 33.00 15.52 25.07 33.5 86% 2.6% 28.0 2010 31.82 1.03 0.64 1.92 20.31 14.16 17.03 16.5 62% 3.8% 28.1 2011 41.94 1.29 0.64 2.04 18.42 13.36 16.27 12.6 50% 3.9% 28.1 2012 45.49 (3.25) 0.64 2.86 16.82 12.74 14.50 nmf nmf 4.4% 28.3 2013 43.25 0.69 0.64 1.99 13.30 9.28 11.26 16.4 93% 5.7% 28.3 2014 40.68 (7.57) 0.32 (0.97) 14.03 11.85 13.00 nmf nmf 2.5% 27.9 nmf = not a meaningful figure. Adjusted for a 3-for-2 stock split in January 1995 and a 50% stock dividend in June 2007. 2EPS = earnings per share; CPS = cash earnings per share; DPS = dividend per share. Source: Author estimates. In August 2015, Larson was considering three possible dividend policies to recommend: Zero-dividend payout: A zero payout could be justified in light of the firm's strategic emphasis on advanced technologies and CAD/CAM, which demanded huge cash requirements to succeed. The proponents of this policy argued that it would signal that the firm now belonged in a class of high-growth and high-technology firms. Some securities analysts wondered whether the market still considered Rockboro a traditional electrical-equipment manufacturer or a more technologically advanced CAD/CAM company. The latter category would imply that the market expected strong capital appreciation, but perhaps little in the way of dividends. Others cited Rockboro's recent performance problems. One questioned the "wisdom of ignoring the financial statements in favor of acting like a blue chip." Was a high dividend in the long-term interests of the company and its stockholders, or would the strategy backfire and make investors skittish? 40% dividend payout or a quarterly dividend of around $0.10 a share: This option would restore the firm to an implied annual dividend payment of $0.40 a share, higher than 2014's dividend of $0.32, but still less than the $0.64 dividend paid in 2013. Proponents of this policy argued that such an announcement was justified by expected increases in orders and sales. Rockboro's investment banker suggested that the stock market would reward a strong dividend that would bring the firm's payout back in line with the 40% average within the electrical-industrial-equipment industry. Some directors agreed and argued that it was important to send a strong signal to shareholders, and that a large dividend (on the order of a 40% payout) would suggest that the company had conquered its problems and that its directors were confident of its future earnings. Finally, some older directors opined that a growth rate in the range of 10% to 20% should accompany a Page 319 Page 318 {" 7:43 PM Wed Apr 17 = 90% QAA Ex directors opined that a growth rate in the range of 10% to 20% should accompany a dividend payout of between 30% and 50%, but not all supported the idea of borrowing to fuel the growth and support that level of dividend. Larson recalled a recently published study reporting that firms had increased their payout ratios to an average of 38% for Q2 2015, from a low of 27% in Q1 2011. Also, the trend since the recession was for more companies to pay dividends. For the S&P 500, about 360 companies paid dividends in Q1 2010 compared to 418 in Q2 2015. Viewed in that light, perhaps the market would expect Rockboro to follow the crowd and would react negatively if Rockboro did not reinstitute a positive dividend-payout policy. Residual-dividend payout: A few members of the finance department argued that Rockboro should pay dividends only after it had funded all the projects that offered positive net present values (NPV). Their view was that investors paid managers to deploy their funds at returns better than they could otherwise achieve, and that, by definition, such investments would yield positive NPVs. By deploying funds into those projects and returning otherwise unused funds to investors in the form of dividends, the firm would build trust with investors and be rewarded through higher valuation multiples. Another argument in support of that view was that the particular dividend policy was irrelevant in a growing firm: any dividend paid today would be offset by dilution at some future date by the issuance of shares needed to make up for the dividend. This argument reflected the theory of dividends in a perfect market advanced by two finance professors, Merton Miller and Franco Modigliani. To Sara Larson, the main disadvantage of this policy was that dividend payments would be unpredictable. In some years, dividends could even be cut to zero, possibly imposing negative pressure on the firm's share price. Larson was all too aware of Rockboro's own share-price collapse following its dividend cut. She recalled a study by another finance professor, John Lintner, which found that firms' dividend payments tended to be "sticky" upwardthat is, dividends would rise over time and rarely fall, and that mature, slower-growth firms paid higher dividends, while high-growth firms paid lower dividends. In response to the internal debate, Larson's staff pulled together comparative information on companies in three industriesCAD/CAM, machine tools, and electrical-industrial equipment and a sample of high- and low-payout companies (Exhibits 26.6 and 26.7). To test Page 320 the feasibility of a 40% dividend-payout rate, Larson developed a projected sources- and-uses-of-cash statement (Exhibit 26.8). She took an optimistic approach by assuming that the company would grow at a 15% compound rate, that margins would improve steadily, and that the firm would pay a dividend of 40% of earnings every year. In particular, the forecast assumed that the firm's net margin would gradually improve from 4.0% in 2015 to 6.5% in 2020 and 2021. The firm's operating executives believed that this increase in profitability was consistent with economies of scale and the higher margins associated with the Artificial TT 7 1 C Page 319 7:43 PM Wed Apr 17 = QAA Ex consistent with economies of scale and the higher margins associated with the Artificial Intelligence Workforce series. EXHIBIT 26.6 I Comparative Industry Data Annual growth Rockboro Machine Tools Corp. rate of cash flow Current Current Sales ($ millions) Last 5 Next 3-5 years years payout dividend Debt/ Insider P/E ratio yield equity ownership ratio 1,135 -1.5% 15.0% nmf 0% 28.4% 34.3% nmf CAD/CAM companies (software and hardware) Autodesk, Inc. 2,512 3.0% 10.5% Ansys, Inc. 941 14.5% 6.5% Cadence Design 1,702 0.0% 10.0% Mentor Graphics 1,244 43.0% 4.0% PTC 1,357 8.5% 4.5% Synopsys, Inc. 2,058 11.0% 7.5% 0% 0% 0% 0% 0% 0% RRRRRR 0% 33.7% 1.0% nmf 0% 0.0% 1.9% 23.0 0% 26.1% 3.2% 17.6 0% 18.1% 2.6% 16.9 0% 68.7% 1.4% 26.4 0% 1.5% 1.4% 15.4 Electrical-industrial equipment manufacturers Emerson Electric Company 22,304 3.5% 3.5% 47% 3% 52.8% 0.8% 17.6 Hubbell Inc. 3,359 7.5% 6.0% 37% 2% 31.0% 1.3% 21.3 Rockwell Auto 6,624 12.5% 5.5% 39% 2% 34.1% 1.5% 19.9 Machine tool manufacturers Actuant Corp. 1,400 6.0% 5.5% 2% 0.1% 38.5% 3.7% 19.2 Lincoln Electric Holdings, Inc. 2,813 11.5% 3.5% 24% 1% 0.2% 3.3% 18.3 Milacron, Inc. 1,211 nmf nmf 0% 0% 265.1% 0.0% nmf Snap-On Inc. 3,278 9.5% 8.5% 26% 2% 39.1% 3.4% 16.8 nmf = not a meaningful figure. Rockboro cash flow growth calculations use an adjusted cash flow for 2014 that omits the restructuring costs. 2 Based on book values. Data source: "Value Line Investment Survey," February 2016. EXHIBIT 26.7 1 Selected Healthy Companies with High- and Zero-Dividend Payouts Industry Expected return on total capital (next 3-5 years) Expected growth rate of dividends (next 3-5 years) Current dividend payout Current dividend yield Expected growth rate of sales (next 3-5 years) Current P/E ratio High-Payout Companies Pfizer Suburban Propane CenturyLink, Inc. Southern Company Dow Chemical Ford Motor Co. Pharmaceutical 13.0% 6.0% 73.8% 3.6% 1.5% 21.1 Oil/gas pipeline-MLP 8.0% 1.0% 212.1% 8.2% 1.5% 24.5 Telecommunications utility 5.5% 3.0% 86.4% 6.7% 3.0% 12.8 Electric utility 6.5% 3.0% 75.1% 4.8% 3.5% 16.5 Chemical manufacturing 10.5% 11.0% 46.0% 4.6% 7.0% 12.4 Auto manufacturer 7.5% 14.5% 43.1% 4.1% 2.5% 8.3 Zero-Payout Companies AutoZone Auto parts 38.5% 0.0% 0.0% 0.0% 12.8% 19.7 Popeyes Fried chicken fast food 21.0% 0.0% 0.0% 0.0% 14.5% 28.8 Manhatttan Assoc Supply chain IT 27.5% 0.0% 0.0% 0.0% 10.0% 50.1 Biogen Biotechnology 27.0% 0.0% 0.0% 0.0% 14.0% 16.6 Sirius XM Entertainment radio 26.5% 0.0% 0.0% 0.0% 8.5% 26.4 Amazon.com, Inc. Online retail 15.0% 0.0% 0.0% 0.0% 17.5% nmf A master limited partnership (MLP) paid no corporate taxes. All income taxes were paid by shareholders on their share of taxable earnings. Data source: "Value Line Investment Survey," August 2015. EXHIBIT 26.8 I Projected Sources-and-Uses Statement Assuming a 40% Payout Ratio (dollars in millions) Assumptions: 2015 2016 2017 2018 2019 2020 2021 Page 320 * 90% 7:43 PM Wed Apr 17 QAA F EXHIBIT 26.8 I Projected Sources-and-Uses Statement Assuming a 40% Payout Ratio (dollars in millions) Assumptions: 2015 2016 2017 2018 2019 2020 2021 Sales Growth Rate: 15% Net Income as % of Sales 2.1% Dividend Payout Ratio 40.0% 15% 15% 15% 15% 15% 15% 4.0% 5.0% 5.5% 6.0% 6.5% 6.5% 40.0% 40.0% 40.0% 40.0% 40.0% 40.0% Projections 2015 Total 2016 2017 2018 2019 2020 2021 2015-21 $1,305 $1,501 $1,726 $1,985 $2,283 $2,625 $3,019 $14,444 Sales Sources: Net income 27.0 60.0 86.3 Depreciation 33.9 39.0 44.9 Total 61.0 99.1 131.2 160.8 196.3 109.2 137.0 170.6 196.2 51.6 59.4 68.3 78.5 274.7 786.4 375.6 238.9 1,161.9 Uses: Capital expend. 65.3 75.0 86.3 99.3 102.7 118.1 135.9 682.6 Change in working capital 29.3 33.6 38.7 44.5 51.2 58.8 67.7 323.7 Total 94.5 108.7 125.0 143.7 153.9 177.0 203.5 1,006.3 Excess cash/(borrowing needs) (33.6) (9.6) 6.2 17.1 42.4 61.9 71.2 155.7 Dividend 10.8 24.0 34.5 43.7 54.8 68.3 78.5 314.6 After dividend Excess cash/(borrowing needs) ($44.4) ($33.6) ($28.3) ($26.6) ($12.3) ($6.3) ($7.3) ($158.9) 90% *This analysis ignores the effects of borrowing on interest expense. Source: Author estimates. Image Advertising and Name Change As part of a general review of the firm's standing in the financial markets, Rockboro's director of investor relations, Maureen Williams, had concluded that investors misperceived the firm's prospects and that the firm's current name was more consistent with its historical product mix and markets than with those projected for the future. Williams commissioned surveys of readers of financial magazines, which revealed a relatively low awareness of Rockboro and its business. Surveys of stockbrokers revealed a higher awareness of the firm, but a low or mediocre outlook on Rockboro's likely returns to shareholders and its growth prospects. Williams retained a consulting firm that recommended a program of corporate-image advertising targeted toward guiding the opinions of institutional and individual investors. The objective was to enhance the firm's visibility and image. Through focus groups, the image consultants identified a new name that appeared to suggest the firm's promising new strategy: Rockboro Advanced Systems International, Inc. Williams estimated that the image-advertising campaign and name change would cost approximately $15 million. Stephen Rockman was mildly skeptical. He said, "Do you mean to raise our stock price by 'marketing' our shares? This is a novel approach. Can you sell claims on a company the way Procter & Gamble markets soap? The consultants could give no empirical evidence that stock prices responded positively to corporate-image campaigns or name changes, though they did offer some favorable anecdotes. Conclusion Page 320 7:43 PM Wed Apr 17 = 90% QAA F business. Surveys of stockbrokers revealed a higher awareness of the firm, but a low or mediocre outlook on Rockboro's likely returns to shareholders and its growth prospects. Williams retained a consulting firm that recommended a program of corporate-image advertising targeted toward guiding the opinions of institutional and individual investors. The objective was to enhance the firm's visibility and image. Through focus groups, the image consultants identified a new name that appeared to suggest the firm's promising new strategy: Rockboro Advanced Systems International, Inc. Williams estimated that the image-advertising campaign and name change would cost approximately $15 million. Stephen Rockman was mildly skeptical. He said, Do you mean to raise our stock price by 'marketing' our shares? This is a novel approach. Can you sell claims on a company the way Procter & Gamble markets soap?" The consultants could give no empirical evidence that stock prices responded positively to corporate-image campaigns or name changes, though they did offer some favorable anecdotes. Conclusion Larson was in a difficult position. Board members and management disagreed on the very nature of Rockboro's future. Some managers saw the company as entering a new stage of rapid growth and thought that a large (or, in the minds of some, any) dividend would be inappropriate. Others thought that it was important to make a strong public gesture showing that management believed that Rockboro had turned the corner and was about to return to the levels of growth and profitability seen prior to the last five to six years. This action could only be accomplished through a dividend. Then there was the confounding question about the stock buyback. Should Rockboro use its funds to repurchase stocks instead of paying out a dividend? As Larson wrestled with the different points of view, she wondered whether Rockboro's management might be representative of the company's shareholders. Did the majority of public shareholders own stock for the same reason, or were their reasons just as diverse as those of management? Page 320 Page 321 Page 322 Page 323 Page 324 Page 325 Page 326 Page 327 Page 328 Rockboro Machine Tools Corporation 1. What are the implications of different payout levels for Rockboro's capital structure and unused debt capacity? 2. What is the nature of the dividend decision that Larson must make? What are the pros and cons of the alternative positions? (Or alternatively, why pay any dividends?) How will Rockboro's various providers of capital, such as its stockholders and bankers, react to a declaration of no dividend? What about the announcement of a 40% payout? How would they react to a residual payout? What risks does the firm face? 3. 4. What is the nature of the share repurchase decision that Larson must make? How would this affect the dividend decision? 5. Does the stock market appear to reward high-dividend payout? What about low-dividend payout? Does it matter what type of investor owns the shares? What is the impact on share price of dividend policy? 6. Should Larson recommend the corporate-image advertising campaign and corporate name change to Rockboro's directors? Do the advertising and name change have any bearing on the dividend policy or the stock-repurchase policy that you propose? 7. What should Larson recommend? Hint: Model the projected stock price (various methods can be used - but please pick a method(s) that you can crisply explain in class). Assume (if needed): WACC = 10%, Terminal Value growth rate = 2.5% 7:42 PM Wed Apr 17 = 91% QAA F CASE 26 Rockboro Machine Tools Corporation Page 313 On September 15, 2015, Sara Larson, chief financial officer (CFO) of Rockboro Machine Tools Corporation (Rockboro), paced the floor of her Minnesota office. She needed to submit a recommendation to Rockboro's board of directors regarding the company's dividend policy, which had been the subject of an ongoing debate among the firm's senior managers. Larson knew that the board was optimistic about Rockboro's future, but there was a lingering uncertainty regarding the company's competitive position. Like many companies following the "great recession" of 2008 and 2009, Rockboro had succeeded in recovering revenues back to prerecession levels. Unlike most other companies, however, Rockboro had not been able to recover its profit margins, and without a much-improved cost structure, it would be difficult for Rockboro to compete with the rising presence of foreign competition that had surfaced primarily from Asia. The board's optimism was fueled by the signs that the two recent restructurings would likely return Rockboro to competitive profit margins and allow the company to compete for its share of the global computer-aided design and manufacturing (CAD/CAM) market. There were two issues that complicated Larson's dividend policy recommendation. First, she had to consider that over the past four years Rockboro shareholders had watched their investment return them no capital gain (i.e., the current stock price of $15.25 was exactly the same as it had been on September 15, 2011). The only return shareholders had received was dividends, which amounted to an average annual return of 2.9% and compared poorly to an annual return of 12.9% earned by the average stock over the same period. The second complication was that the 2008 recession had prompted a number of companies to repurchase shares either in lieu of or in addition to paying a dividend. A share repurchase was considered a method for management and the board to signal confidence in their company and was usually greeted with a stock price increase when announced. Rockboro had repurchased $15.8 million of shares in 2009, but had not used share buybacks since then. Larson recognized, therefore, that her recommendation needed to include whether to use company funds to buy back stock, pay dividends, do both, or do neither. Background on the Dividend Question Page 314 Prior to the recession of 2008, Rockboro had enjoyed years of consistent earnings and predictable dividend growth. As the financial crisis was unfolding, Rockboro's board decided to maintain a steady dividend and to postpone any dividend increases until Rockboro's future became more certain. That policy had proven to be expensive since earnings recovered much more slowly than was hoped and dividend payout rose above 50% for the years 2009 through Page 313 7:42 PM Wed Apr 17 = QAA F 891% more slowly than was hoped and dividend payout rose above 50% for the years 2009 through 2011. To address the profit-margin issue, management implemented two extensive restructuring programs, both of which were accompanied by net losses. Dividends were maintained at $0.64/share until the second restructuring in 2014, when dividends were reduced by half for the year. For the first two quarters of 2015, the board declared no dividend. But in a special letter to shareholders, the board committed itself to resuming payment of the dividend "as soon as possible-ideally, sometime in 2015." In a related matter, senior management considered embarking on a campaign of corporate- image advertising, together with changing the name of the corporation to Rockboro Advanced Systems International, Inc. Management believed that the name change would help improve the investment community's perception of the company. Overall, management's view was that Rockboro was a resurgent company that demonstrated great potential for growth and profitability. The restructurings had revitalized the company's operating divisions. In addition, a newly developed software product promised to move the company beyond its machine- tool business into licensing of its state-of-the-art design software that provided significant efficiencies for users and was being well received in the market, with expectations of rendering many of the competitors' products obsolete. Many within the company viewed 2015 as the dawning of a new era, which, in spite of the company's recent performance, would turn Rockboro into a growth stock. Out of this combination of a troubled past and a bright future arose Larson's dilemma. Did the market view Rockboro as a company on the wane, a blue-chip stock, or a potential growth stock? How, if at all, could Rockboro affect that perception? Would a change of name help to positively frame investors' views of the firm? Did the company's investors expect capital growth or steady dividends? Would a stock buyback affect investors' perceptions of Rockboro in any way? And, if those questions could be answered, what were the implications for Rockboro's future dividend policy? The Company Rockboro was founded in 1923 in Concord, New Hampshire, by two mechanical engineers, James Rockman and David Pittsboro. The two men had gone to school together and were disenchanted with their prospects as mechanics at a farm-equipment manufacturer. Page 315 In its early years, Rockboro had designed and manufactured a number of machinery parts, including metal presses, dies, and molds. In the 1940s, the company's large manufacturing plant produced armored-vehicle and tank parts and miscellaneous equipment for the war effort, including riveters and welders. After the war, the company concentrated on the production of industrial presses and molds, for plastics as well as metals. By 1975, the company had developed a reputation as an innovative producer of industrial machinery and machine tools. In the early 1980s. Rockboro entered the new field of computer-aided design and computer- Page 314 7:42 PM Wed Apr 17 = QAA Ex 90% In the early 1980s, Rockboro entered the new field of computer-aided design and computer- aided manufacturing (CAD/CAM). Working with a small software company, it developed a line of presses that could manufacture metal parts by responding to computer commands. Rockboro merged the software company into its operations and, over the next several years, perfected the CAM equipment. At the same time, it developed a superior line of CAD software and equipment that allowed an engineer to design a part to exacting specifications on a computer. The design could then be entered into the company's CAM equipment, and the parts could be manufactured without the use of blueprints or human interference. By the end of 2014, CAD/CAM equipment and software were responsible for about 45% of sales; presses, dies, and molds made up 40% of sales; and miscellaneous machine tools were 15% of sales. Most press-and-mold companies were small local or regional firms with a limited clientele. For that reason, Rockboro stood out as a true industry leader. Within the CAD/CAM industry, however, a number of larger firms, including Autodesk, Inc., Cadence Design, and Synopsys, Inc., competed for dominance of the growing market. Throughout the 1990s and into the first decade of the 2000s, Rockboro helped set the standard for CAD/CAM, but the aggressive entry of large foreign firms into CAD/CAM had dampened sales. Technological advances and significant investments had fueled the entry of highly specialized, state-of-the-art CAD/CAM firms. By 2009, Rockboro had fallen behind its competition in the development of user-friendly software and the integration of design and manufacturing. As a result, revenues had barely recovered beyond the prerecession-level high of $1.07 billion in 2008, to $1.13 billion in 2014, and profit margins were getting compressed because the company was having difficulty containing costs. To combat the weak profit margins, Rockboro took a two-pronged approach. First, a much larger share of the research-and-development budget was devoted to CAD/CAM, in an effort to reestablish Rockboro's leadership in the field. Second, the company underwent two massive restructurings. In 2012, it sold three unprofitable business lines and two plants, eliminated five leased facilities, and reduced personnel. Restructuring costs totaled $98 million. Then, in 2014, the company began a second round of restructuring by refocusing its sales and marketing approach and adopting administrative procedures that allowed for a further reduction in staff and facilities. The total cost of the operational restructuring in 2014 was $134 million. The company's recent financial statements (Exhibits 26.1 and 26.2) revealed that although the restructurings produced losses totaling $303 million, the projected results for 2015 suggested that the restructurings and the increased emphasis on new product development had launched a turnaround. Not only was the company becoming leaner, but also the investment in research and development had led to a breakthrough in Rockboro's CAD/CAM software that management believed would redefine the industry. Known as the Artificial Intelligence Workforce (AIW), the system was an array of advanced control hardware, software, and applications that continuously distributed and coordinated information throughout a plant. Essentially, AIW allowed an engineer to design a part on CAD software and Page 316 Page 315 7:42 PM Wed Apr 17 E QAA F 90% throughout a plant. Essentially, AIW allowed an engineer to design a part on CAD software and input the data into CAM equipment that controlled the mixing of chemicals or the molding of parts from any number of different materials on different machines. The system could also assemble and can, box, or shrink-wrap the finished product. As part of the licensing agreements for the software, Rockboro engineers provided consulting to specifically adapt the software to each client's needs. Thus regardless of its complexity, a product could be designed, manufactured, and packaged solely by computer. Most importantly, however, Rockboro's software used simulations to test new product designs prior to production. This capability was enhanced by the software's capability to improve the design based on statistical inferences drawn from Rockboro's large proprietary database. EXHIBIT 26.1 I Consolidated Income Statements (dollars in thousands, except per-share data) Projected 2012 2013 2014 2015 Net sales Cost of sales Gross profit $1,287,394 $1,223,969 $1,134,956 $1,305,000 811,121 752,186 748,319 824,625 476,273 471,782 386,638 480,375 Research and development 116,516 105,818 113,126 115,875 Selling, general, and administrative 344,957 335,450 346,511 317,250 Restructuring costs 98,172 0 134,116 Operating profit (loss) (83,372) 30,515 (207,115) 47,250 Other income (expense) (6,750) 1,598 (5,186) (6,300) Income (loss) before taxes (90,122) 32,112 (212,301) 40,950 Income taxes (benefit) 1,861 12,623 (1,125) 13,923 Net income (loss) ($91,982) $ 19,490 ($211,176) $ 27,027 Earnings (loss) per share ($3.25) $ 0.69 ($7.57) $ 0.98 Dividends per share 0.64 $ 0.64 $ 0.32 $ 0.39 Note: The dividends in 2015 assume a payout ratio of 40%. Source: Author estimates. EXHIBIT 26.2 | Consolidated Balance Sheets (dollars in thousands) 2013 2014 Projected 2015 Cash and equivalents $ 20,876 $ 33,345 $ 38,498 Accounts receivable 312,812 280,853 326,265 Inventories 345,513 305,832 325,832 Prepaid expenses 21,389 19,524 22,517 Other 33,276 31,071 31,500 Total current assets 733,865 670,625 744,611 Property, plant, and equipment 491,405 538,262 616,482 Less depreciation 251,121 275,229 308,295 Net property, plant, and equipment 240,284 263,033 308,187 Intangible assets 14,144 Other assets 23,585 3,149 26,532 Total assets $1,011,876 $963,338 Bank loans $ 51,294 $107,018 Accounts payable Current portion of long-term debt Accruals and other 54,674 450 194,061 51,359 225 2,273 26,954 $1,082,024 $ 112,472 56,291 2,273 242,450 Total current liabilities 300,479 401,051 274,521 445,556 Page 316 7:43 PM Wed Apr 17 EXHIBIT 26.2 I Consolidated Balance Sheets (dollars in thousands) QAA F 90% Projected 2013 2014 2015 Cash and equivalents $ Accounts receivable Inventories 20,876 312,812 $ 33,345 $ 38,498 280,853 326,265 345,513 305,832 325,832 Prepaid expenses Other 21,389 19,524 22,517 33,276 31,071 31,500 Total current assets 733,865 670,625 744,611 Property, plant, and equipment 491,405 538,262 616,482 Less depreciation 251,121 275,229 308,295 Net property, plant, and equipment 240,284 263,033 308,187 Intangible assets 14,144 3,149 2,273 Other assets 23,585 26,532 26,954 Total assets $1,011,876 $963,338 Bank loans $ 51,294 $107,018 Accounts payable 54,674 Current portion of long-term debt 450 51,359 225 $1,082,024 $ 112,472 56,291 2,273 Accruals and other 194,061 242,450 274,521 Total current liabilities 300,479 401,051 445,556 Deferred taxes 25,479 20,654 24,789 Long-term debt 13,500 13,163 45,032 Deferred pension costs 67,185 96,488 105,240 Other liabilities 3,477 8,166 11,258 Total liabilities 410,120 539,520 631,874 Common stock, $1 par value 28,283 28,283 28,253 Capital in excess of par 161,811 161,861 161,834 Cumulative translation adjustment (9,849) 30,312 40,485 Retained earnings 437,247 219,098 235,313 Less treasury stock at cost: (15,735) (15,735) (15,735) Total shareholders' equity Total liabilities and equity 601,757 $1,011,876 423,818 450,149 $963,338 $1,082,022 Note: Projections assume a dividend-payout ratio of 40%. Source: Author estimates. Rockboro had developed AIW applications for the chemicals industry and for the oil- and gas-refining industries in 2014 and, by the next year, it would complete applications for the trucking, automobile-parts, and airline industries. By October 2014, when the first AIW system was shipped, Rockboro had orders totaling $115 million. By year-end 2014, the backlog had grown to $150 million. The future for the product looked bright. Several securities analysts were optimistic about the product's impact on the company. The following comments paraphrase their thoughts: The Artificial Intelligence Workforce system has compelling advantages over competing entries, which will enable Rockboro to increase its share of a market that, ignoring periodic growth spurts, will expand at a real annual rate of about 5% over the next several years. Rockboro's engineering team is producing the AIW applications at an impressive rate, which will help restore margins to levels not seen in years. The important question now is how quickly Rockboro will be able to sell licenses in volume. Start-up costs, which were a significant factor in last year's deficits, have continued to penalize Page 316 * 7:43 PM Wed Apr 17 E 90% QAA F Start-up costs, which were a significant factor in last year's deficits, have continued to penalize earnings. Our estimates assume that adoption rates will proceed smoothly from now on and that AIW will have gained significant market share by year-end 2016. Rockboro's management expected domestic revenues from the Artificial Intelligence Workforce series to total $135 million in 2015 and $225 million in 2016. Thereafter, growth in sales would depend on the development of more system applications and the creation of system improvements and add-on features. International sales through Rockboro's existing offices in Frankfurt, London, Milan, and Paris and new offices in Hong Kong, Shanghai, Seoul, Manila, and Tokyo were expected to help meet foreign competition head on and to provide additional revenues of $225 million by as early as 2017. Currently, international sales accounted for approximately 15% of total corporate revenues. Page 317 Two factors that could affect sales were of some concern to management. First, although Rockboro had successfully patented several of the processes used by the AIW system, management had received hints through industry observers that two strong competitors were developing comparable systems and would probably introduce them within the next 12 months. Second, sales of molds, presses, machine tools, and CAD/CAM equipment and software were highly cyclical, and current predictions about the strength of the United States and other major economies were not encouraging. As shown in Exhibit 26.3, real GDP (gross domestic product) growth was expected to expand to 2.9% by 2016, and industrial production, which had improved significantly for 2014 to 4.2% growth, was projected to decline in 2015 before recovering to 3.6% by 2016. Despite the lukewarm macroeconomic environment, Rockboro's management remained optimistic about the company's prospects because of the successful introduction of the AIW series. EXHIBIT 26.3 I Economic Indicators and Projections (all numbers are percentages) Projected 2011 2012 2013 2014 2015 2016 Three-month Treasury bill rate 0.1% 0.1% 0.1% 0.1% 0.3% 1.2% 10-year Treasury note yield 2.8% 1.8% 2.4% 2.5% 2.2% 2.9% AAA corporate bond rate 4.6% 3.7% 4.2% 4.2% 3.8% 4.6% Percent change in: Real gross domestic product 1.6% 2.3% 2.2% 2.4% 2.3% 2.9% Industrial production 3.3% 3.8% 2.9% 4.2% 0.5% 3.6% Consumer price index 3.1% 2.1% 1.5% 1.6% 0.3% 2.2% Data source: "Value Line Investment Survey," August 2015. Corporate Goals A number of corporate objectives had grown out of the restructurings and recent technological advances. First and foremost, management wanted and expected revenues to grow at an average annual compound rate of 15%. With the improved cost structure, profit growth was expected to in line mouth dool of inch dhoon dossated Page 316 7:43 PM Wed Apr 17 = QAA E 90% annual compound rate of 15%. With the improved cost structure, profit growth was expected to exceed top-line growth. A great deal of corporate planning had been devoted to the growth goal over the past three years and, indeed, second-quarter financial data suggested that Rockboro would achieve revenues of about $1.3 billion in 2015. If Rockboro achieved a 15% compound rate of revenue growth through 2021, the company would reach $3.0 billion in sales and $196 million in net income. In order to achieve their growth objective, Rockboro management proposed a strategy relying on three key points. First, the mix of production would shift substantially. CAD/CAM with emphasis on the AIW system would account for three-quarters of sales, while the company's traditional presses and molds would account for the remainder. Second, the company would expand aggressively in the global markets, where it hoped to obtain half of its sales and profits by 2021. This expansion would be achieved through opening new field sales offices around the world, including Hong Kong, Shanghai, Seoul, Manila, and Tokyo. Third, the company would expand through joint ventures and acquisitions of small software companies, which would provide half of the new products through 2021; in-house research would provide the other half. The company had had an aversion to debt since its inception. Management believed that a small amount of debt, primarily to meet working-capital needs, had its place, but anything beyond a 40% debt-to-equity ratio was, in the oft-quoted words of Rockboro cofounder David Pittsboro, unthinkable, indicative of sloppy management, and flirting with trouble. Senior management was aware that equity was typically more costly than debt, but took great satisfaction in the company doing it on its own." Rockboro's highest debt-to-capital ratio in the past 25 years (28%) had occurred in 2014 and was still the subject of conversations among senior managers. Although 11 members of the Rockman and the Pittsboro families owned 13% of the company's stock and three were on the board of directors, management placed the interests of the outside shareholders first (Exhibit 26.4). Stephen Rockman, board chair and grandson of the cofounder, sought to maximize growth in the market value of the company's stock over time. At 61, Rockman was actively involved in all aspects of the company's growth. He dealt fluently with a range of technical details of Rockboro's products and was especially interested in finding ways to improve the company's domestic market share. His retirement was no Page 318 more than four years away, and he wanted to leave a legacy of corporate financial strength and technological achievement. The Artificial Intelligence Workforce, a project that he had taken under his wing four years earlier, was finally beginning to bear fruit. Rockman now wanted to ensure that the firm would also soon be able to pay a dividend to its shareholders. EXHIBIT 26.4 I Comparative Stockholder Data, 2004 and 2014 (in thousands of shares) 2014 Shares 2004 Percentage Shares Percentage Page 317 7:43 PM Wed Apr 17 EXHIBIT 26.4 I Comparative Stockholder Data, 2004 and 2014 (in thousands of shares) 2014 QAA Ex 2004 Shares Percentage Shares Percentage Founders' families 3,585 13% 5,113 18% Employees and families 5,516 20% 4,443 16% Institutional investors Growth oriented 3,585 13% 1,602 6% Value oriented 2,207 8% 3,409 12% Individual investors Long term; retirement 10,205 37% 6,767 24% Short term; trading oriented Other; unknown 1,379 5% 3,409 12% 1,103 4% 3,153 11% Total 27,578 100% 27,896 100% Note: The investor-relations department identified these categories from company records. The type of institutional investor was identified from promotional materials stating the investment goals of the institutions. The type of individual investor was identified from a survey of subsamples of investors. Source: Author estimates. Rockman took particular pride in selecting and developing promising young managers. Sara Larson had a bachelor's degree in electrical engineering and had been a systems analyst for Motorola before attending graduate school. She had been hired in 2005, fresh out of a well- known MBA program. By 2014, she had risen to the position of CFO. Dividend Policy Before 2009, Rockboro's earnings and dividends per share had grown at a relatively steady pace (Exhibit 26.5). Following the recession, cost-control problems became apparent because earnings were not able to rebound to prerecession levels. The board maintained dividends at $0.64 per year until 2014 when the restructuring expenses led to the largest per-share earnings loss in the firm's history. To conserve cash, the board voted to pare back dividends by 50% to $0.32 a sharethe lowest dividend since 1998. Paying any dividend with such high losses effectively meant that Rockboro had to borrow to pay the dividend. In response to the financial pressure, the directors elected to not declare a dividend for the first two quarters of 2015. In a special letter to shareholders, however, the directors declared their intention to continue the annual payout later in 2015. EXHIBIT 26.5 I Per-Share Financial and Stock Data1 Stock price Year Sales/ share Avg. Payout Avg. EPS2 DPS2 CPS2 High Low Avg. P/E ratio yield Shares outstanding (millions) 2000 $16.12 $1.19 $0.37 $2.03 $21.11 2001 15.00 1.28 0.39 2.14 21.23 $10.18 8.20 $14.85 12.5 31% 2.5% 23.4 13.50 10.5 30% 2.9% 24.1 2002 15.23 0.45 0.40 1.17 18.50 10.18 13.35 29.8 88% 3.0% 26.8 2003 16.37 0.86 0.42 1.65 22.48 12.17 18.36 21.4 48% 2.3% 27.1 2004 21.08 1.27 0.45 2.13 23.84 18.01 21.00 16.5 35% 2.1% 27.6 2005 24.93 1.90 0.47 2.86 26.70 18.25 22.73 11.9 25% 2.1% 28.0 2006 30.10 2.67 0.51 3.75 34.34 22.75 30.31 11.3 19% 1.7% 28.1 2007 34.59 3.07 0.59 4.22 44.13 32.66 38.29 12.5 19% 1.5% 28.2 2008 37.80 3.24 0.64 4.41 46.73 20.81 36.58 11.3 20% 1.7% 28.3 Page 318 90% 7:43 PM Wed Apr 17 EXHIBIT 26.5 I Per-Share Financial and Stock Data1 Stock price QAA EX 90% Year Sales/ share Avg. Payout Avg. Shares outstanding EPS DPS2 CPS2 High Low Avg. P/E ratio yield (millions) 2000 $16.12 $1.19 $0.37 $2.03 $21.11 $10.18 $14.85 12.5 31% 2.5% 23.4 2001 15.00 1.28 0.39 2.14 21.23 8.20 13.50 10.5 30% 2.9% 24.1 2002 15.23 0.45 0.40 1.17 18.50 10.18 13.35 29.8 88% 3.0% 26.8 2003 16.37 0.86 0.42 1.65 22.48 12.17 18.36 21.4 48% 2.3% 27.1 2004 21.08 1.27 0.45 2.13 23.84 18.01 21.00 16.5 35% 2.1% 27.6 2005 24.93 1.90 0.47 2.86 26.70 18.25 22.73 11.9 25% 2.1% 28.0 2006 30.10 2.67 0.51 3.75 34.34 22.75 30.31 11.3 19% 1.7% 28.1 2007 34.59 3.07 0.59 4.22 44.13 32.66 38.29 12.5 19% 1.5% 28.2 2008 37.80 3.24 0.64 4.41 46.73 20.81 36.58 11.3 20% 1.7% 28.3 2009 26.61 0.75 0.64 1.52 33.00 15.52 25.07 33.5 86% 2.6% 28.0 2010 31.82 1.03 0.64 1.92 20.31 14.16 17.03 16.5 62% 3.8% 28.1 2011 41.94 1.29 0.64 2.04 18.42 13.36 16.27 12.6 50% 3.9% 28.1 2012 45.49 (3.25) 0.64 2.86 16.82 12.74 14.50 nmf nmf 4.4% 28.3 2013 43.25 0.69 0.64 1.99 13.30 9.28 11.26 16.4 93% 5.7% 28.3 2014 40.68 (7.57) 0.32 (0.97) 14.03 11.85 13.00 nmf nmf 2.5% 27.9 nmf = not a meaningful figure. Adjusted for a 3-for-2 stock split in January 1995 and a 50% stock dividend in June 2007. 2EPS = earnings per share; CPS = cash earnings per share; DPS = dividend per share. Source: Author estimates. In August 2015, Larson was considering three possible dividend policies to recommend: Zero-dividend payout: A zero payout could be justified in light of the firm's strategic emphasis on advanced technologies and CAD/CAM, which demanded huge cash requirements to succeed. The proponents of this policy argued that it would signal that the firm now belonged in a class of high-growth and high-technology firms. Some securities analysts wondered whether the market still considered Rockboro a traditional electrical-equipment manufacturer or a more technologically advanced CAD/CAM company. The latter category would imply that the market expected strong capital appreciation, but perhaps little in the way of dividends. Others cited Rockboro's recent performance problems. One questioned the "wisdom of ignoring the financial statements in favor of acting like a blue chip." Was a high dividend in the long-term interests of the company and its stockholders, or would the strategy backfire and make investors skittish? 40% dividend payout or a quarterly dividend of around $0.10 a share: This option would restore the firm to an implied annual dividend payment of $0.40 a share, higher than 2014's dividend of $0.32, but still less than the $0.64 dividend paid in 2013. Proponents of this policy argued that such an announcement was justified by expected increases in orders and sales. Rockboro's investment banker suggested that the stock market would reward a strong dividend that would bring the firm's payout back in line with the 40% average within the electrical-industrial-equipment industry. Some directors agreed and argued that it was important to send a strong signal to shareholders, and that a large dividend (on the order of a 40% payout) would suggest that the company had conquered its problems and that its directors were confident of its future earnings. Finally, some older directors opined that a growth rate in the range of 10% to 20% should accompany a Page 319 Page 318 {" 7:43 PM Wed Apr 17 = 90% QAA Ex directors opined that a growth rate in the range of 10% to 20% should accompany a dividend payout of between 30% and 50%, but not all supported the idea of borrowing to fuel the growth and support that level of dividend. Larson recalled a recently published study reporting that firms had increased their payout ratios to an average of 38% for Q2 2015, from a low of 27% in Q1 2011. Also, the trend since the recession was for more companies to pay dividends. For the S&P 500, about 360 companies paid dividends in Q1 2010 compared to 418 in Q2 2015. Viewed in that light, perhaps the market would expect Rockboro to follow the crowd and would react negatively if Rockboro did not reinstitute a positive dividend-payout policy. Residual-dividend payout: A few members of the finance department argued that Rockboro should pay dividends only after it had funded all the projects that offered positive net present values (NPV). Their view was that investors paid managers to deploy their funds at returns better than they could otherwise achieve, and that, by definition, such investments would yield positive NPVs. By deploying funds into those projects and returning otherwise unused funds to investors in the form of dividends, the firm would build trust with investors and be rewarded through higher valuation multiples. Another argument in support of that view was that the particular dividend policy was irrelevant in a growing firm: any dividend paid today would be offset by dilution at some future date by the issuance of shares needed to make up for the dividend. This argument reflected the theory of dividends in a perfect market advanced by two finance professors, Merton Miller and Franco Modigliani. To Sara Larson, the main disadvantage of this policy was that dividend payments would be unpredictable. In some years, dividends could even be cut to zero, possibly imposing negative pressure on the firm's share price. Larson was all too aware of Rockboro's own share-price collapse following its dividend cut. She recalled a study by another finance professor, John Lintner, which found that firms' dividend payments tended to be "sticky" upwardthat is, dividends would rise over time and rarely fall, and that mature, slower-growth firms paid higher dividends, while high-growth firms paid lower dividends. In response to the internal debate, Larson's staff pulled together comparative information on companies in three industriesCAD/CAM, machine tools, and electrical-industrial equipment and a sample of high- and low-payout companies (Exhibits 26.6 and 26.7). To test Page 320 the feasibility of a 40% dividend-payout rate, Larson developed a projected sources- and-uses-of-cash statement (Exhibit 26.8). She took an optimistic approach by assuming that the company would grow at a 15% compound rate, that margins would improve steadily, and that the firm would pay a dividend of 40% of earnings every year. In particular, the forecast assumed that the firm's net margin would gradually improve from 4.0% in 2015 to 6.5% in 2020 and 2021. The firm's operating executives believed that this increase in profitability was consistent with economies of scale and the higher margins associated with the Artificial TT 7 1 C Page 319 7:43 PM Wed Apr 17 = QAA Ex consistent with economies of scale and the higher margins associated with the Artificial Intelligence Workforce series. EXHIBIT 26.6 I Comparative Industry Data Annual growth Rockboro Machine Tools Corp. rate of cash flow Current Current Sales ($ millions) Last 5 Next 3-5 years years payout dividend Debt/ Insider P/E ratio yield equity ownership ratio 1,135 -1.5% 15.0% nmf 0% 28.4% 34.3% nmf CAD/CAM companies (software and hardware) Autodesk, Inc. 2,512 3.0% 10.5% Ansys, Inc. 941 14.5% 6.5% Cadence Design 1,702 0.0% 10.0% Mentor Graphics 1,244 43.0% 4.0% PTC 1,357 8.5% 4.5% Synopsys, Inc. 2,058 11.0% 7.5% 0% 0% 0% 0% 0% 0% RRRRRR 0% 33.7% 1.0% nmf 0% 0.0% 1.9% 23.0 0% 26.1% 3.2% 17.6 0% 18.1% 2.6% 16.9 0% 68.7% 1.4% 26.4 0% 1.5% 1.4% 15.4 Electrical-industrial equipment manufacturers Emerson Electric Company 22,304 3.5% 3.5% 47% 3% 52.8% 0.8% 17.6 Hubbell Inc. 3,359 7.5% 6.0% 37% 2% 31.0% 1.3% 21.3 Rockwell Auto 6,624 12.5% 5.5% 39% 2% 34.1% 1.5% 19.9 Machine tool manufacturers Actuant Corp. 1,400 6.0% 5.5% 2% 0.1% 38.5% 3.7% 19.2 Lincoln Electric Holdings, Inc. 2,813 11.5% 3.5% 24% 1% 0.2% 3.3% 18.3 Milacron, Inc. 1,211 nmf nmf 0% 0% 265.1% 0.0% nmf Snap-On Inc. 3,278 9.5% 8.5% 26% 2% 39.1% 3.4% 16.8 nmf = not a meaningful figure. Rockboro cash flow growth calculations use an adjusted cash flow for 2014 that omits the restructuring costs. 2 Based on book values. Data source: "Value Line Investment Survey," February 2016. EXHIBIT 26.7 1 Selected Healthy Companies with High- and Zero-Dividend Payouts Industry Expected return on total capital (next 3-5 years) Expected growth rate of dividends (next 3-5 years) Current dividend payout Current dividend yield Expected growth rate of sales (next 3-5 years) Current P/E ratio High-Payout Companies Pfizer Suburban Propane CenturyLink, Inc. Southern Company Dow Chemical Ford Motor Co. Pharmaceutical 13.0% 6.0% 73.8% 3.6% 1.5% 21.1 Oil/gas pipeline-MLP 8.0% 1.0% 212.1% 8.2% 1.5% 24.5 Telecommunications utility 5.5% 3.0% 86.4% 6.7% 3.0% 12.8 Electric utility 6.5% 3.0% 75.1% 4.8% 3.5% 16.5 Chemical manufacturing 10.5% 11.0% 46.0% 4.6% 7.0% 12.4 Auto manufacturer 7.5% 14.5% 43.1% 4.1% 2.5% 8.3 Zero-Payout Companies AutoZone Auto parts 38.5% 0.0% 0.0% 0.0% 12.8% 19.7 Popeyes Fried chicken fast food 21.0% 0.0% 0.0% 0.0% 14.5% 28.8 Manhatttan Assoc Supply chain IT 27.5% 0.0% 0.0% 0.0% 10.0% 50.1 Biogen Biotechnology 27.0% 0.0% 0.0% 0.0% 14.0% 16.6 Sirius XM Entertainment radio 26.5% 0.0% 0.0% 0.0% 8.5% 26.4 Amazon.com, Inc. Online retail 15.0% 0.0% 0.0% 0.0% 17.5% nmf A master limited partnership (MLP) paid no corporate taxes. All income taxes were paid by shareholders on their share of taxable earnings. Data source: "Value Line Investment Survey," August 2015. EXHIBIT 26.8 I Projected Sources-and-Uses Statement Assuming a 40% Payout Ratio (dollars in millions) Assumptions: 2015 2016 2017 2018 2019 2020 2021 Page 320 * 90% 7:43 PM Wed Apr 17 QAA F EXHIBIT 26.8 I Projected Sources-and-Uses Statement Assuming a 40% Payout Ratio (dollars in millions) Assumptions: 2015 2016 2017 2018 2019 2020 2021 Sales Growth Rate: 15% Net Income as % of Sales 2.1% Dividend Payout Ratio 40.0% 15% 15% 15% 15% 15% 15% 4.0% 5.0% 5.5% 6.0% 6.5% 6.5% 40.0% 40.0% 40.0% 40.0% 40.0% 40.0% Projections 2015 Total 2016 2017 2018 2019 2020 2021 2015-21 $1,305 $1,501 $1,726 $1,985 $2,283 $2,625 $3,019 $14,444 Sales Sources: Net income 27.0 60.0 86.3 Depreciation 33.9 39.0 44.9 Total 61.0 99.1 131.2 160.8 196.3 109.2 137.0 170.6 196.2 51.6 59.4 68.3 78.5 274.7 786.4 375.6 238.9 1,161.9 Uses: Capital expend. 65.3 75.0 86.3 99.3 102.7 118.1 135.9 682.6 Change in working capital 29.3 33.6 38.7 44.5 51.2 58.8 67.7 323.7 Total 94.5 108.7 125.0 143.7 153.9 177.0 203.5 1,006.3 Excess cash/(borrowing needs) (33.6) (9.6) 6.2 17.1 42.4 61.9 71.2 155.7 Dividend 10.8 24.0 34.5 43.7 54.8 68.3 78.5 314.6 After dividend Excess cash/(borrowing needs) ($44.4) ($33.6) ($28.3) ($26.6) ($12.3) ($6.3) ($7.3) ($158.9) 90% *This analysis ignores the effects of borrowing on interest expense. Source: Author estimates. Image Advertising and Name Change As part of a general review of the firm's standing in the financial markets, Rockboro's director of investor relations, Maureen Williams, had concluded that investors misperceived the firm's prospects and that the firm's current name was more consistent with its historical product mix and markets than with those projected for the future. Williams commissioned surveys of readers of financial magazines, which revealed a relatively low awareness of Rockboro and its business. Surveys of stockbrokers revealed a higher awareness of the firm, but a low or mediocre outlook on Rockboro's likely returns to shareholders and its growth prospects. Williams retained a consulting firm that recommended a program of corporate-image advertising targeted toward guiding the opinions of institutional and individual investors. The objective was to enhance the firm's visibility and image. Through focus groups, the image consultants identified a new name that appeared to suggest the firm's promising new strategy: Rockboro Advanced Systems International, Inc. Williams estimated that the image-advertising campaign and name change would cost approximately $15 million. Stephen Rockman was mildly skeptical. He said, "Do you mean to raise our stock price by 'marketing' our shares? This is a novel approach. Can you sell claims on a company the way Procter & Gamble markets soap? The consultants could give no empirical evidence that stock prices responded positively to corporate-image campaigns or name changes, though they did offer some favorable anecdotes. Conclusion Page 320 7:43 PM Wed Apr 17 = 90% QAA F business. Surveys of stockbrokers revealed a higher awareness of the firm, but a low or mediocre outlook on Rockboro's likely returns to shareholders and its growth prospects. Williams retained a consulting firm that recommended a program of corporate-image advertising targeted toward guiding the opinions of institutional and individual investors. The objective was to enhance the firm's visibility and image. Through focus groups, the image consultants identified a new name that appeared to suggest the firm's promising new strategy: Rockboro Advanced Systems International, Inc. Williams estimated that the image-advertising campaign and name change would cost approximately $15 million. Stephen Rockman was mildly skeptical. He said, Do you mean to raise our stock price by 'marketing' our shares? This is a novel approach. Can you sell claims on a company the way Procter & Gamble markets soap?" The consultants could give no empirical evidence that stock prices responded positively to corporate-image campaigns or name changes, though they did offer some favorable anecdotes. Conclusion Larson was in a difficult position. Board members and management disagreed on the very nature of Rockboro's future. Some managers saw the company as entering a new stage of rapid growth and thought that a large (or, in the minds of some, any) dividend would be inappropriate. Others thought that it was important to make a strong public gesture showing that management believed that Rockboro had turned the corner and was about to return to the levels of growth and profitability seen prior to the last five to six years. This action could only be accomplished through a dividend. Then there was the confounding question about the stock buyback. Should Rockboro use its funds to repurchase stocks instead of paying out a dividend? As Larson wrestled with the different points of view, she wondered whether Rockboro's management might be representative of the company's shareholders. Did the majority of public shareholders own stock for the same reason, or were their reasons just as diverse as those of management? Page 320 Page 321 Page 322 Page 323 Page 324 Page 325 Page 326 Page 327 Page 328
Expert Answer:

Posted Date:
Students also viewed these finance questions
-
In Exercises 6780, begin by graphing the square root function, f(x) = x. Then use transformations of this graph to graph the given function. h(x)=x + 2-2
-
What is a ping, and how does it work?
-
Brian Fry Products manufactures a variety of machine tools and parts used primarily in industrial tasks. To control production, the company requires the information listed below. Design an efficient...
-
In order to create a digital signature a. the sender encrypts a hash using the recipients public key b. the sender encrypts a hash using the senders private key c. the sender encrypts a hash using...
-
The following elements of stockholders equity are from the balance sheet of Sacchetti Marketing Corp. at December 31, 2015: Stockholders' Equity Paid-In Capital: Preferred Stock5%, $2 Par Value;...
-
However, below are four steps solution we can use to mitigate some of these challenges. Identify and prioritize risks - Using a Failure Modes and Effects Analysis scoring system to identify and...
-
Consider two countries, A and B, that produce two goods, X and Y. The production of each good requires a fixed quantity of labor and capital. Country A has 300 units of labor and 600 units of...
-
A tow truck pulls a car 5 km along a horizontal road, using a cable whose tension is 850 N. Consider that the car is stuck and therefore the friction force exerted by the pavement is 250 N. a) How...
-
Question 5 1 kg of saturated water at 10 bar is heated to 400 C adiabatically. What is the amount of heat added through this process? A 2501 kJ B 3264 kJ (C) 763 kJ D) 4027 kJ 2 Points
-
An investor has a portfolio comprised of stock A, which has a beta of 0.60 and an expected return of 30%, and Treasury bills, which have an expected return of 1.9%. The portfolio has an expected...
-
Question 6 2 Points A Carnot heat engine has an efficiency of 40 %6. If the same engine was used as a Carnot refrigeration cycle what would be the coefficient of performance and the heat absorbed if...
-
What is critical chain management. How is it different from critical path management? Use your own words to show that you understand the definitions.
-
The Capital Allocation Line can be described as the : a) investment opportunity set formed with two risky assets. b) investment opportunity set formed with a risky asset portfolio and a risk-free...
-
(a) Find the equation of the tangent line to f(x) = x 3 at the point where x = 2. (b) Graph the tangent line and the function on the same axes. If the tangent line is used to estimate values of the...
-
The following data were obtained from the year-end financial statements of The Arcadia Company: Required Compute the following ratios for The Arcadia Company: (1) Return on Sales, (2) Return on...
-
The Arcadia Company was founded by Thomas Smith and began operations in July 2015 as a neighborhood hardware store, selling branded lawn and garden supplies, household products, and small tools. The...
-
Use the information for Hamlet House in Exercise E9-15 and assume a tax rate for the company of 35 percent. a. If Hamlet House wants to earn an after-tax profit of \(\$ 182,000\), how many garden...

Study smarter with the SolutionInn App