

Question: Roll # Name: Section: Date: Part B: Drawing with a pencil, the calibration trend-line of the spectroscope and using it to correct other spectral observations.
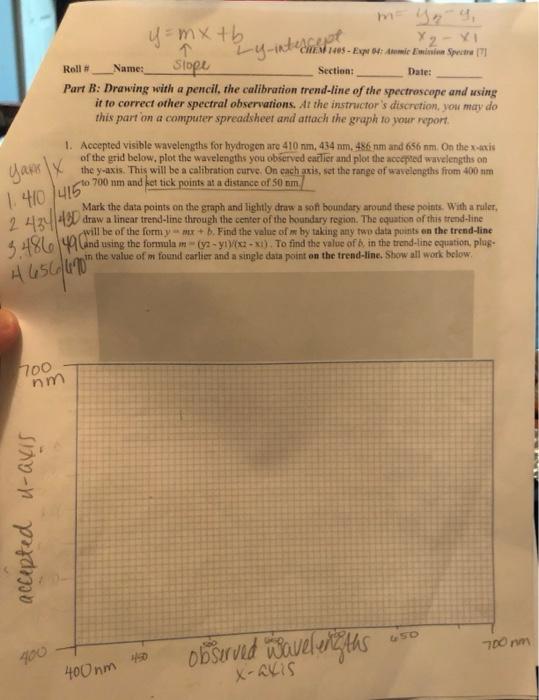
Roll \# Name: Section: Date: Part B: Drawing with a pencil, the calibration trend-line of the spectroscope and using it to correct other spectral observations. At the instructor's discrction. you may do this part on a computer spreadsheet and attach the graph to your report. 1. Accepted visible wavelengths for bydrogen are 410nm,434nm,486nm and 656nm. On the xaxis of the grid below, plot the wavelengths you observed eadier and plot the acceped wavelenpths on the y-axis. This will be a calibration curve: On each axis, set the range of wavelengths from 400nm to 700nm and het tick noints at a distance of 50nm. 46 4) Mark the daaa points on the graph and lightly draw a sof boundary around these poiats. With a ruler. diaw a linear trend-line through the center of the heundary region. The cquation of this trend-fine will be of the form y=mx+b. Find the value of m by taking any fwo data points en the trend-line 4. Cand using the fommula in - (y2y1)(x2x1). To find the value of b in the trend-line cquation, plag: (f2)inthevalueofm found earlier and a single data point on the trend-line. Show all work below
Step by Step Solution
There are 3 Steps involved in it

Get step-by-step solutions from verified subject matter experts