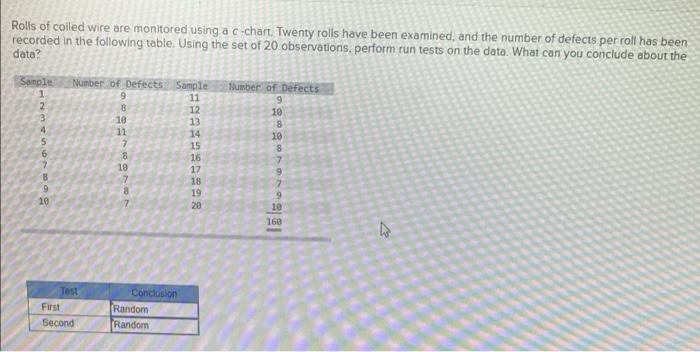
Question: Rolls of coiled wire are monitored using a c-chart. Twenty rolls have been examined, and the number of defects per roll has been recorded in

Rolls of coiled wire are monitored using a
Rolls of coiled wire are monitored using a c-chart. Twenty rolls have been examined, and the number of defects per roll has been recorded in the following table. Using the set of 20 observations, perform run tests on the data. What can you conclude about the data? Sample 1 Number of Defects Sample Number of Defects 9 8 10 11 3 4 5 6 DOWN Ennu 11 12 13 14 15 16 17 18 19 20 8 19 8 7 7 9 10 8 Telovov 10 160 Test First Second Conclusion Random Random The process specifications are 13.25 and 14.25 minutes. Based on the data given, does it appear that specifications are being met? Sample 1 13.3 13.4 Samole 4 13.8 Sample 2 13.5 13.3 14.4 13.4 54.6 13.8 Sample 3 13.6 13.3 13.9 13.5 54.1 14.3 Sample 5 13.4 13.3 14.0 13.5 54.3 13.6 13.3 55.0 13.4 53.9 Totals Yes ONO The following is a control chart for the average number of minor errors in 22 service reports, UCL LCL a. Calculate the observed mean, expected mean, standard deviation and z value for the median and up/down test. Use z = -l-2 10 compare your z test scores. (Negative amounts should be indicated by a minus sign. Round your answers to 2 decimal places.) Observed Expected Sid dev Test Median Up/Down b.Based on your calculation conclude whether the test is random or non-random Conclusion Test Median Up/Down

Step by Step Solution

There are 3 Steps involved in it

1 Expert Approved Answer
Step: 1 Unlock blur-text-image
Question Has Been Solved by an Expert!

Get step-by-step solutions from verified subject matter experts

Step: 2 Unlock
Step: 3 Unlock

Students Have Also Explored These Related General Management Questions!