

Question: Round 1- - Develop your generic strategy. Who is your target market? What will be your competitive advantage? - What positions do you need to
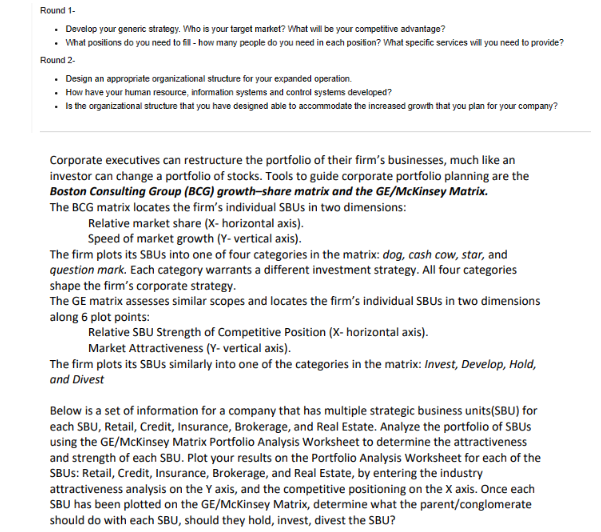
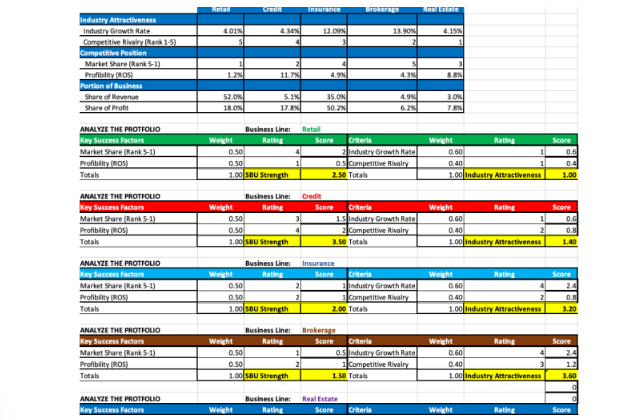
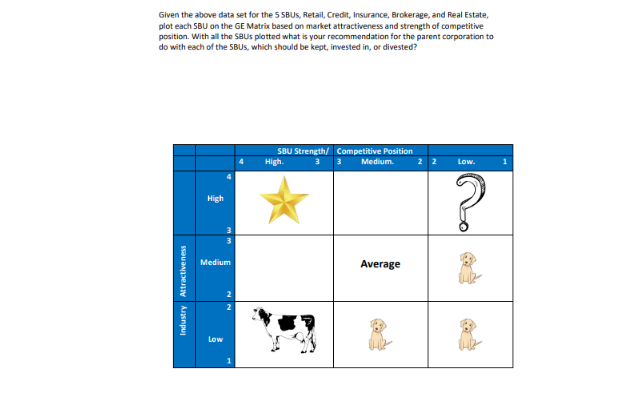
Round 1- - Develop your generic strategy. Who is your target market? What will be your competitive advantage? - What positions do you need to fll - how many people do you need in each posifion? What specific services will you need to provide? Round 2 . - Design an appropriate organizational structure for your expanded operation. - How have your human resource, information systems and control syslems developed? - Is the organizational structure that you have designed able to accommodate the increased growth that you plan for your company? Corporate executives can restructure the portfolio of their firm's businesses, much like an investor can change a portfolio of stocks. Tools to guide corporate portfolio planning are the Boston Consulting Group (BCG) growth-share matrix and the GE/McKinsey Matrix. The BCG matrix locates the firm's individual SBUs in two dimensions: Relative market share ( X - horizontal axis). Speed of market growth ( Y - vertical axis). The firm plots its SBUs into one of four categories in the matrix: dog, cash cow, star, and question mark. Each category warrants a different investment strategy. All four categories shape the firm's corporate strategy. The GE matrix assesses similar scopes and locates the firm's individual SBUs in two dimensions along 6 plot points: Relative SBU Strength of Competitive Position (X-horizontal axis). Market Attractiveness ( Y - vertical axis). The firm plots its SBUs similarly into one of the categories in the matrix: Invest, Develop, Hold, and Divest Below is a set of information for a company that has multiple strategic business units(SBU) for each SBU, Retail, Credit, Insurance, Brokerage, and Real Estate. Analyze the portfolio of SBUs using the GE/McKinsey Matrix Portfolio Analysis Worksheet to determine the attractiveness and strength of each SBU. Plot your results on the Portfolio Analysis Worksheet for each of the SBUs: Retail, Credit, Insurance, Brokerage, and Real Estate, by entering the industry attractiveness analysis on the Y axis, and the competitive positioning on the X axis. Once each SBU has been plotted on the GE/McKinsey Matrix, determine what the parent/conglomerate should do with each SBU, should they hold, invest, divest the SBU? Given the above data set for the 5 SBUs, Retail, Credit, Insurance, Brokerage, and Real Estate, plot each SBU on the GE Matrix based on market attractiveness and strength of competitive position. With all the SBUs plotted what is your recommendation for the parent corporation to do with each of the SBUs, which should be kept, invested in, of divested? Round 1- - Develop your generic strategy. Who is your target market? What will be your competitive advantage? - What positions do you need to fll - how many people do you need in each posifion? What specific services will you need to provide? Round 2 . - Design an appropriate organizational structure for your expanded operation. - How have your human resource, information systems and control syslems developed? - Is the organizational structure that you have designed able to accommodate the increased growth that you plan for your company? Corporate executives can restructure the portfolio of their firm's businesses, much like an investor can change a portfolio of stocks. Tools to guide corporate portfolio planning are the Boston Consulting Group (BCG) growth-share matrix and the GE/McKinsey Matrix. The BCG matrix locates the firm's individual SBUs in two dimensions: Relative market share ( X - horizontal axis). Speed of market growth ( Y - vertical axis). The firm plots its SBUs into one of four categories in the matrix: dog, cash cow, star, and question mark. Each category warrants a different investment strategy. All four categories shape the firm's corporate strategy. The GE matrix assesses similar scopes and locates the firm's individual SBUs in two dimensions along 6 plot points: Relative SBU Strength of Competitive Position (X-horizontal axis). Market Attractiveness ( Y - vertical axis). The firm plots its SBUs similarly into one of the categories in the matrix: Invest, Develop, Hold, and Divest Below is a set of information for a company that has multiple strategic business units(SBU) for each SBU, Retail, Credit, Insurance, Brokerage, and Real Estate. Analyze the portfolio of SBUs using the GE/McKinsey Matrix Portfolio Analysis Worksheet to determine the attractiveness and strength of each SBU. Plot your results on the Portfolio Analysis Worksheet for each of the SBUs: Retail, Credit, Insurance, Brokerage, and Real Estate, by entering the industry attractiveness analysis on the Y axis, and the competitive positioning on the X axis. Once each SBU has been plotted on the GE/McKinsey Matrix, determine what the parent/conglomerate should do with each SBU, should they hold, invest, divest the SBU? Given the above data set for the 5 SBUs, Retail, Credit, Insurance, Brokerage, and Real Estate, plot each SBU on the GE Matrix based on market attractiveness and strength of competitive position. With all the SBUs plotted what is your recommendation for the parent corporation to do with each of the SBUs, which should be kept, invested in, of divested
Step by Step Solution
There are 3 Steps involved in it

Get step-by-step solutions from verified subject matter experts