

Question: Round figures to 2 decimal places, if needed. Multiple choice statements are either about correct or clearly wrong. Statistical tables are available at this link.
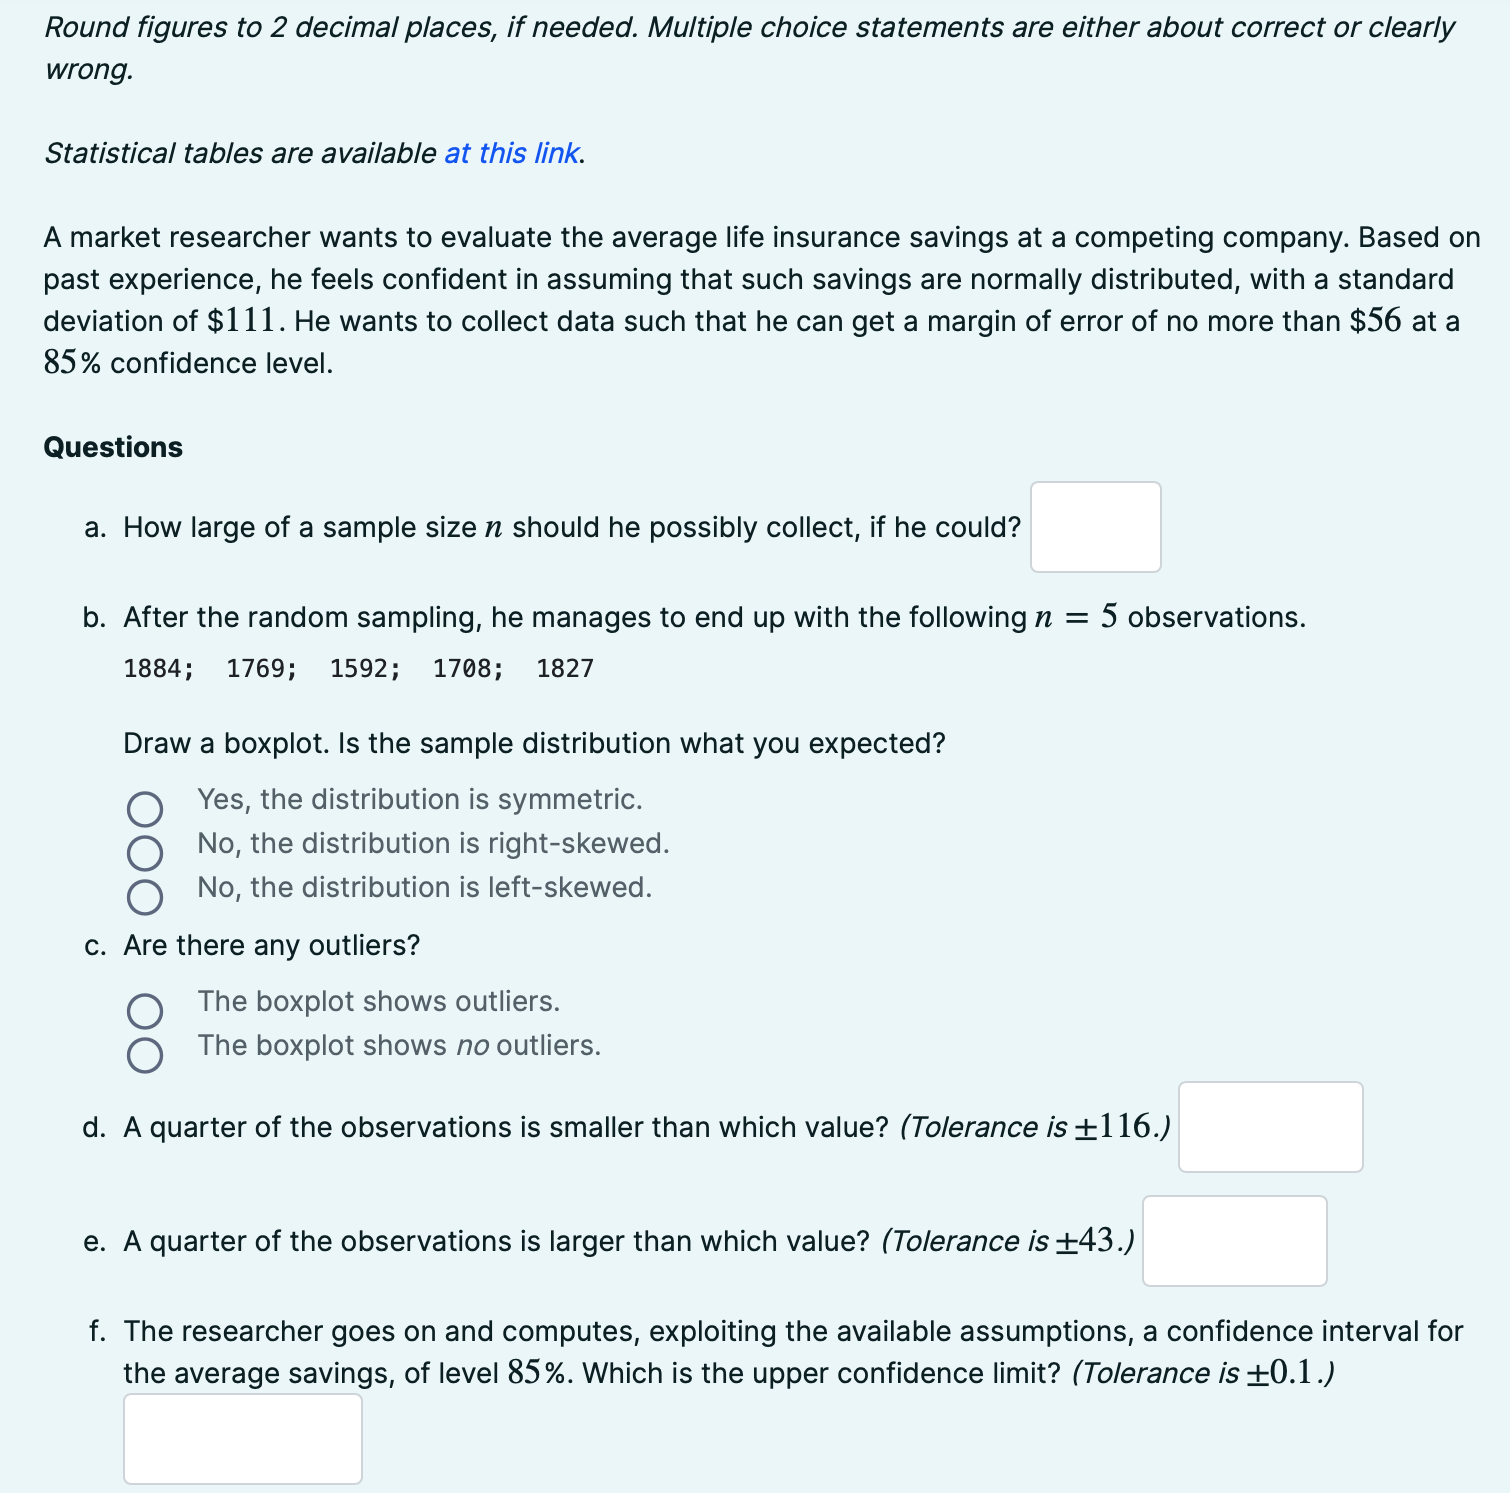
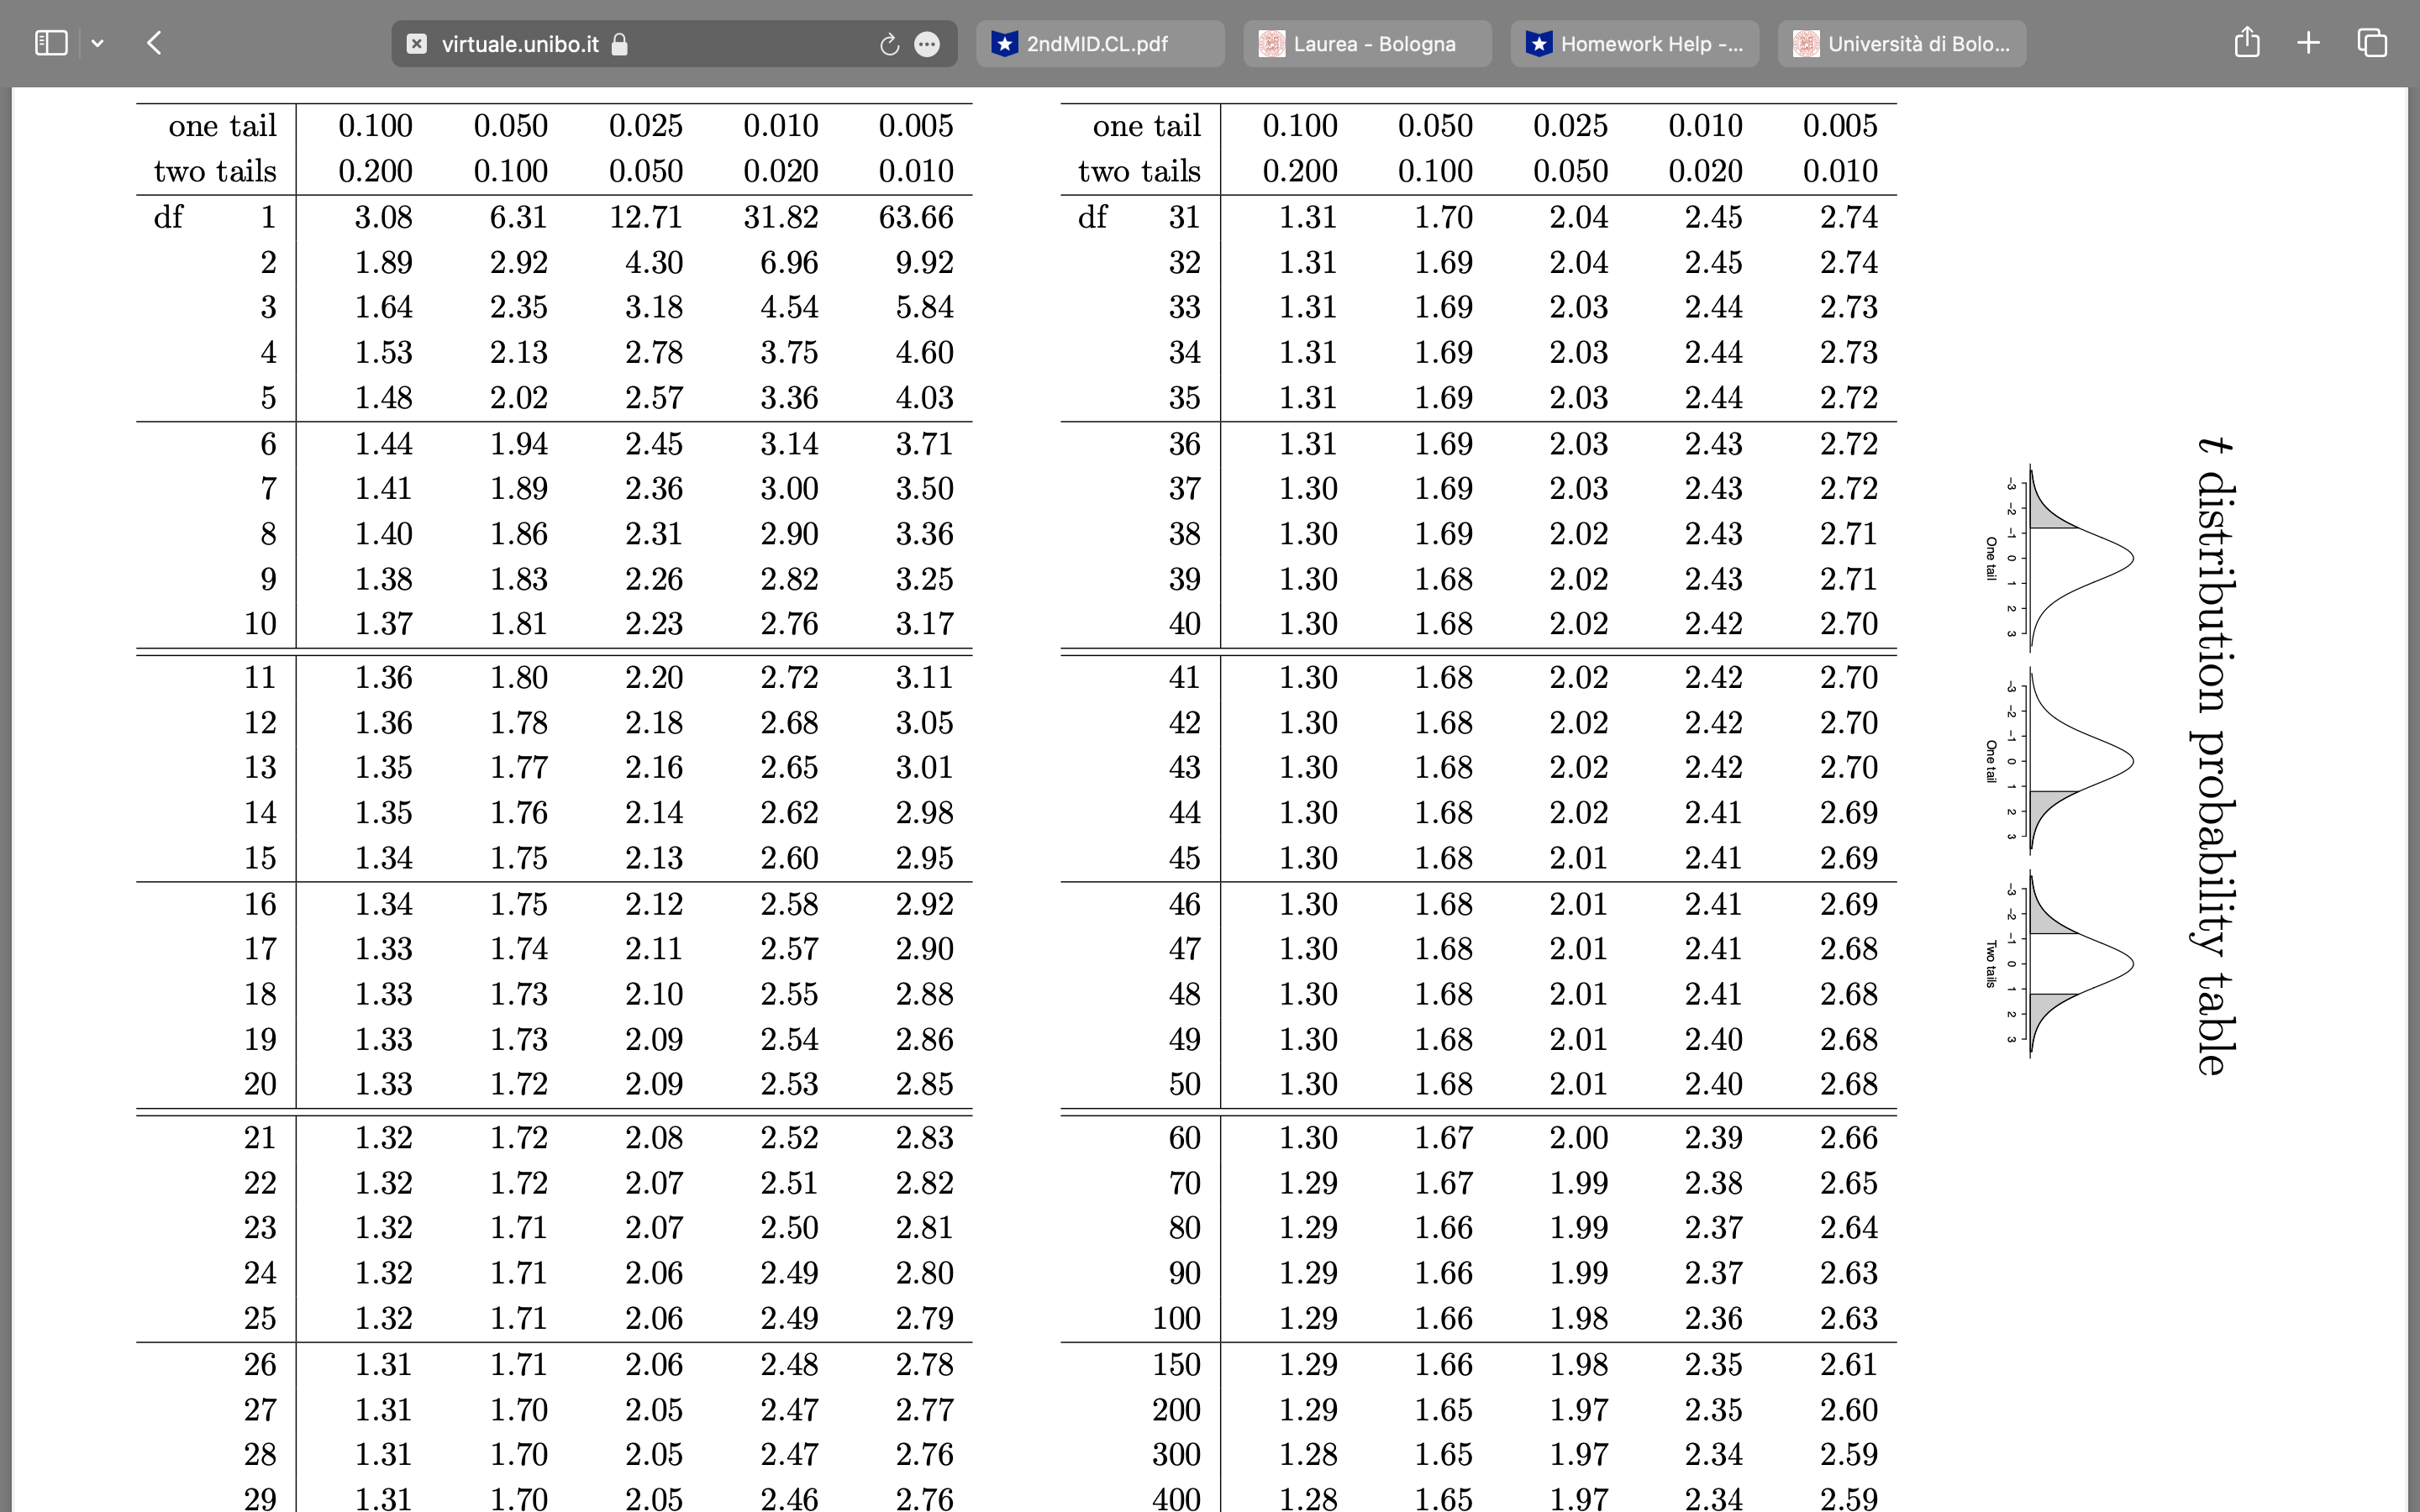
Round figures to 2 decimal places, if needed. Multiple choice statements are either about correct or clearly wrong. Statistical tables are available at this link. A market researcher wants to evaluate the average life insurance savings at a competing company. Based on past experience, he feels confident in assuming that such savings are normally distributed, with a standard deviation of $111. He wants to collect data such that he can get a margin of error of no more than $56 at a 85% confidence level. Questions a. How large of a sample size n should he possibly collect, if he could? b. After the random sampling, he manages to end up with the following n = 5 observations. 1884; 1769; 1592; 1708; 1827 Draw a boxplot. Is the sample distribution what you expected? Yes, the distribution is symmetric. No, the distribution is right-skewed. O No, the distribution is left-skewed. c. Are there any outliers? O The boxplot shows outliers. O The boxplot shows no outliers. d. A quarter of the observations is smaller than which value? (Tolerance is +116.) e. A quarter of the observations is larger than which value? (Tolerance is +43.) f. The researcher goes on and computes, exploiting the available assumptions, a confidence interval for the average savings, of level 85%. Which is the upper confidence limit? (Tolerance is +0.1.) x virtuale.unibo.it C ... 2ndMID.CL.pdf Laurea - Bologna Homework Help -... Universita di Bolo... + one tail 0.100 0.050 0.025 0.010 0.005 one tail 0.100 0.050 0.025 two tails 0.010 0.200 0.005 0.100 0.050 0.020 0.010 two tails 0.200 0.100 0.050 df 0.020 3.08 0.010 6.31 12.71 31.82 63.66 df 31 1.31 1.70 2.04 N 1.89 2.45 2.92 2.74 4.30 6.96 9.92 32 1.31 1.69 2.04 1.64 2.35 2.45 2.74 3.18 4.54 5.84 33 1.31 1.69 2.03 2.44 2.73 1.53 2.13 2.78 3.75 4.60 OT A 34 1.31 1.69 2.03 2.44 1.48 2.02 2.73 2.57 3.36 4.03 35 1.31 1.69 2.03 2.44 1.44 1.94 2.72 2.45 3.14 3.71 36 1.31 1.69 2.03 1.41 1.89 2.43 2.36 2.72 3.00 3.50 37 1.30 1.69 2.03 2.43 1.40 1.86 2.72 2.31 2.90 3.36 38 2 6 00 - 1.30 1.69 2.02 2.43 1.38 1.83 2.71 2.26 2.82 3.25 39 1.30 1.68 One tail 1.37 2.02 1.81 2.43 2.23 2.71 2.76 3.17 40 1.30 1.68 2.02 2.42 2.70 11 1.36 1.80 2.20 2.72 3.11 41 1.30 1.68 12 2.02 1.36 1.78 2.42 2.70 2.18 2.68 3.05 42 1.30 1.68 13 2.02 2.42 1.35 1.77 2.70 2.16 2.65 3.01 43 1.30 1.68 14 2.02 1.35 1.76 2.42 2.70 One tai t distribution probability table 2.14 2.62 2.98 44 1.30 1.68 2.02 15 2.41 1.34 1.75 2.69 2.13 2.60 2.95 45 1.30 1.68 2.01 2.41 16 1.34 1.75 2.69 2.12 2.58 2.92 46 1.30 1.68 17 2.01 1.33 2.41 1.74 2.69 2.11 2.57 2.90 47 1.30 1.68 2.01 18 2.41 1.33 1.73 2.68 2.10 2.55 2.88 Two tails 48 1.30 1.68 2.01 19 2.41 1.33 1.73 2.68 2.09 2.54 2.86 49 1.30 1.68 20 2.01 1.33 2.40 1.72 2.68 2.09 2.53 2.85 50 1.30 1.68 2.01 2.40 2.68 21 1.32 1.72 2.08 2.52 2.83 60 1.30 1.67 22 2.00 2.39 1.32 1.72 2.66 2.07 2.51 2.82 70 1.29 1.67 1.99 23 2.38 1.32 1.71 2.65 2.07 2.50 2.81 80 1.29 1.66 1.99 24 2.37 1.32 1.71 2.64 2.06 2.49 2.80 90 1.29 1.66 25 1.99 1.32 1.71 2.37 2.63 2.06 2.49 2.79 100 1.29 1.66 1.98 26 1.31 1.71 2.36 2.63 2.06 2.48 2.78 150 1.29 1.66 1.98 27 1.31 2.35 1.70 2.61 2.05 2.47 2.77 200 1.29 1.65 28 1.97 1.31 1.70 2.35 2.60 2.05 2.47 2.76 300 29 1.28 1.65 1.97 2.34 70 2.05 2.46 2.59 2.76 400 1.28 65 1.97 2.34 2.59
Step by Step Solution
There are 3 Steps involved in it

Get step-by-step solutions from verified subject matter experts