

Question: round to 2 decimals help me solve the wrong answers Independent Auto Inc. Income Statement ($000) For Years Ended December 31 2020 2019 Net sales
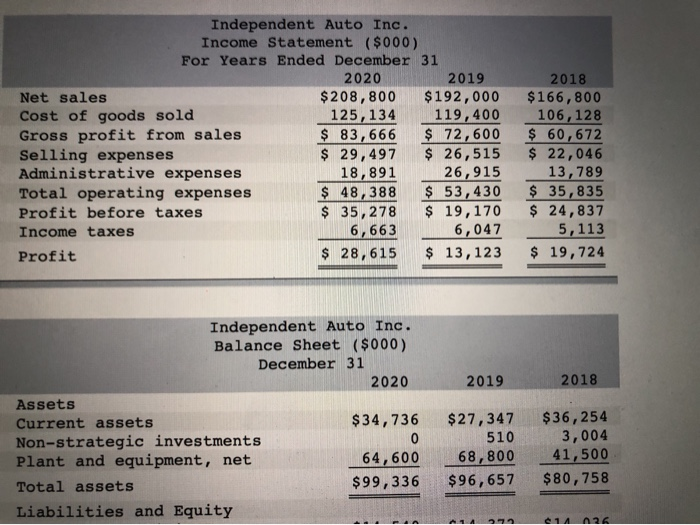
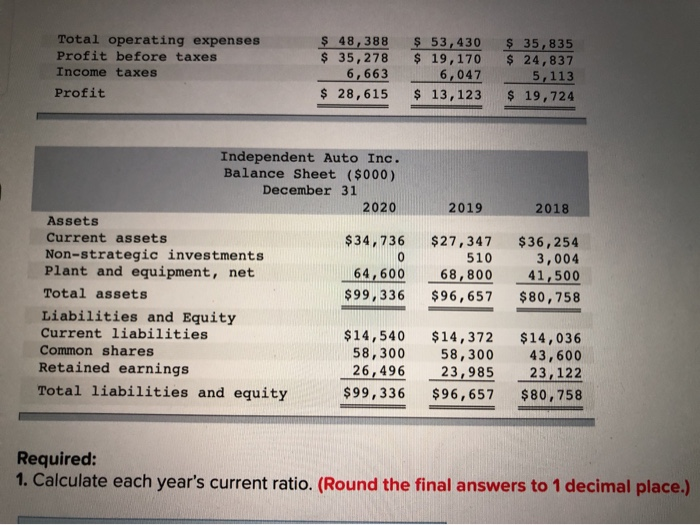
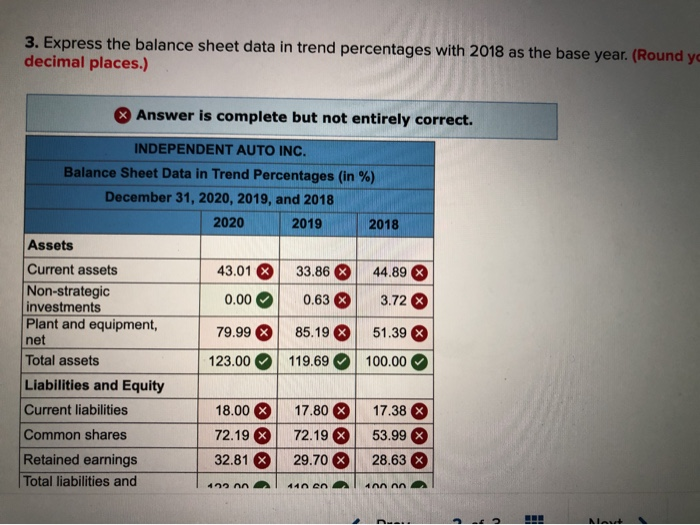
Independent Auto Inc. Income Statement ($000) For Years Ended December 31 2020 2019 Net sales $208,800 $ 192,000 Cost of goods sold 125,134 119,400 Gross profit from sales $ 83,666 $ 72,600 Selling expenses $ 29,497 $ 26,515 Administrative expenses 18,891 26,915 Total operating expenses $ 48,388 $ 53,430 Profit before taxes $ 35, 278 $ 19,170 Income taxes 6,663 6,047 Profit $ 28,615 $ 13, 123 2018 $166,800 106,128 $ 60,672 $ 22,046 13,789 $ 35,835 $ 24,837 5,113 $ 19,724 2019 2018 Independent Auto Inc. Balance Sheet ($000) December 31 2020 Assets Current assets $34,736 Non-strategic investments Plant and equipment, net 64,600 Total assets $99,336 Liabilities and Equity $ 27,347 510 68,800 $96,657 $36,254 3,004 41,500 $80,758 1436 Total operating expenses Profit before taxes Income taxes Profit $ 48,388 $ 53, 430 $ 35, 278 $ 19,170 6,6636 ,047 $ 28,615 $ 13,123 $ 35, 835 $ 24,837 5,113 $ 19,724 2019 2018 Independent Auto Inc. Balance Sheet ($000) December 31 2020 Assets Current assets $34,736 Non-strategic investments Plant and equipment, net 64,600 Total assets $99,336 Liabilities and Equity Current liabilities $14,540 Common shares 58,300 Retained earnings 26,496 Total liabilities and equity $99,336 $27,347 510 68,800 $96,657 $36,254 3,004 41,500 $80,758 $14,372 58,300 23,985 $96,657 $14,036 43,600 23, 122 $80,758 Required: 1. Calculate each year's current ratio. (Round the final answers to 1 decimal place.) 3. Express the balance sheet data in trend percentages with 2018 as the base year. (Round yo decimal places.) & Answer is complete but not entirely correct. INDEPENDENT AUTO INC. Balance Sheet Data in Trend Percentages (in %) December 31, 2020, 2019, and 2018 2020 2019 2018 Assets Current assets 43.01 $ 33.86 X 44.89 Non-strategic 0.00 0.63 3.72 investments Plant and equipment, 79.99 85.19 51.39 net Total assets 123.00 119.69 100.00 Liabilities and Equity Current liabilities 18.00 X 17.80 X 17.38 X Common shares 72.19 % 72.19 53.99 Retained earnings 32.81 29.70 % 28.63% Total liabilities and non al 400 alunanna
Step by Step Solution
There are 3 Steps involved in it

Get step-by-step solutions from verified subject matter experts