

Question: rowth Option: Decision-Tree Analysis ethe's Funny Hats is considering selling trademarked, orange-haired curly wigs for University of Tennessee football games. The purchase cost anchise to
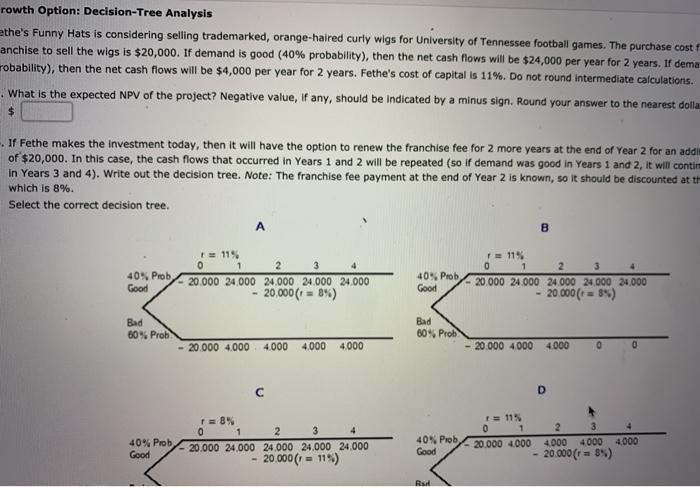
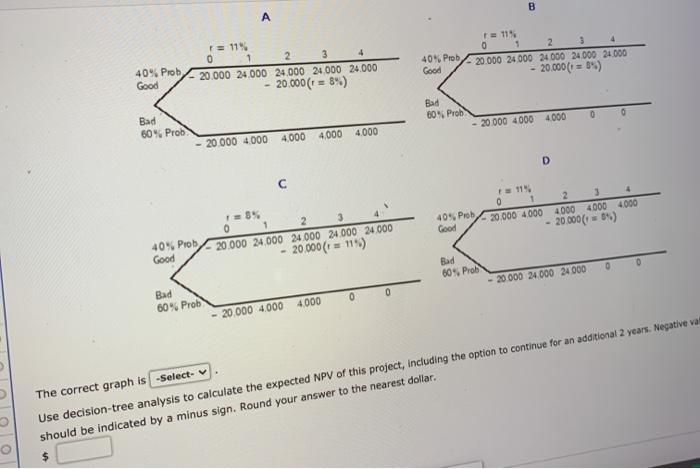
rowth Option: Decision-Tree Analysis ethe's Funny Hats is considering selling trademarked, orange-haired curly wigs for University of Tennessee football games. The purchase cost anchise to sell the wigs is $20,000. If demand is good (40% probability), then the net cash flows will be $24,000 per year for 2 years. If dema robability), then the net cash flows will be $4,000 per year for 2 years. Fethe's cost of capital is 11%. Do not round intermediate calculations. What is the expected NPV of the project? Negative value, if any, should be indicated by a minus sign. Round your answer to the nearest dolla If Fethe makes the investment today, then it will have the option to renew the franchise fee for 2 more years at the end of Year 2 for an addim of $20,000. In this case, the cash flows that occurred in Years 1 and 2 will be repeated (so if demand was good in Years 1 and 2, it will contin In Years 3 and 4). Write out the decision tree. Note: The franchise fee payment at the end of Year 2 is known, so it should be discounted at tt which is 8%. Select the correct decision tree. B 3 1 = 11% 40% Prob 20.000 24000 24000 24.000 24.000 20,000 (r = 8%) 40% Prob Good 11% 0 1 20.000 24.000 24.000 24000 24000 20.000(* = 8) Bad 60% Prob - 20.000 4.000 Bad 60% Prob 4.000 4.000 4.000 20.000 4.000 4000 0 D r = 8% 0 1 2 3 4 20.000 24 000 24,000 24.000 24.000 20.000 (1 = 11%) 11% 0 1 20.000 4.000 40% Prob Good 40% Prob 2 4000 4,000 4.000 20.000 (r = 3%) Good Ra B A 11 0 1 2 3 4 20.000 24.000 24000 24000 24.000 20.000(r = 84) 40% Pb Good TE 11% 0 1 2 20.000 24000 24000 24000 24000 20.000(t = 5) 40% Prob Good Bad 60% Prob 0 20 000 4000 4000 Bad 60% Prob 4000 4000 20 000 4000 4000 D 11% 0 1 2 20.000 4000 4000 4000 4000 20.0000%) 40% Pob Good 40% Prob Good 18% 0 1 2 20.000 24000 24000 24000 24 000 20 000 (1 = 115) 0 Rad 60% Prob - 20000 24000 24000 0 0 Bad 60% Prob 20 000 4.000 4.000 The correct graph is -Select- Use decision-tree analysis to calculate the expected NPV of this project, including the option to continue for an additional 2 years. Negative va should be indicated by a minus sign. Round your answer to the nearest dollar. $
Step by Step Solution
There are 3 Steps involved in it

Get step-by-step solutions from verified subject matter experts