

Question: RSTUDIO Examine the strip plot. It's made from a dataset called olive. The first few rows are shown of this dataset. region oleic 1 Southern
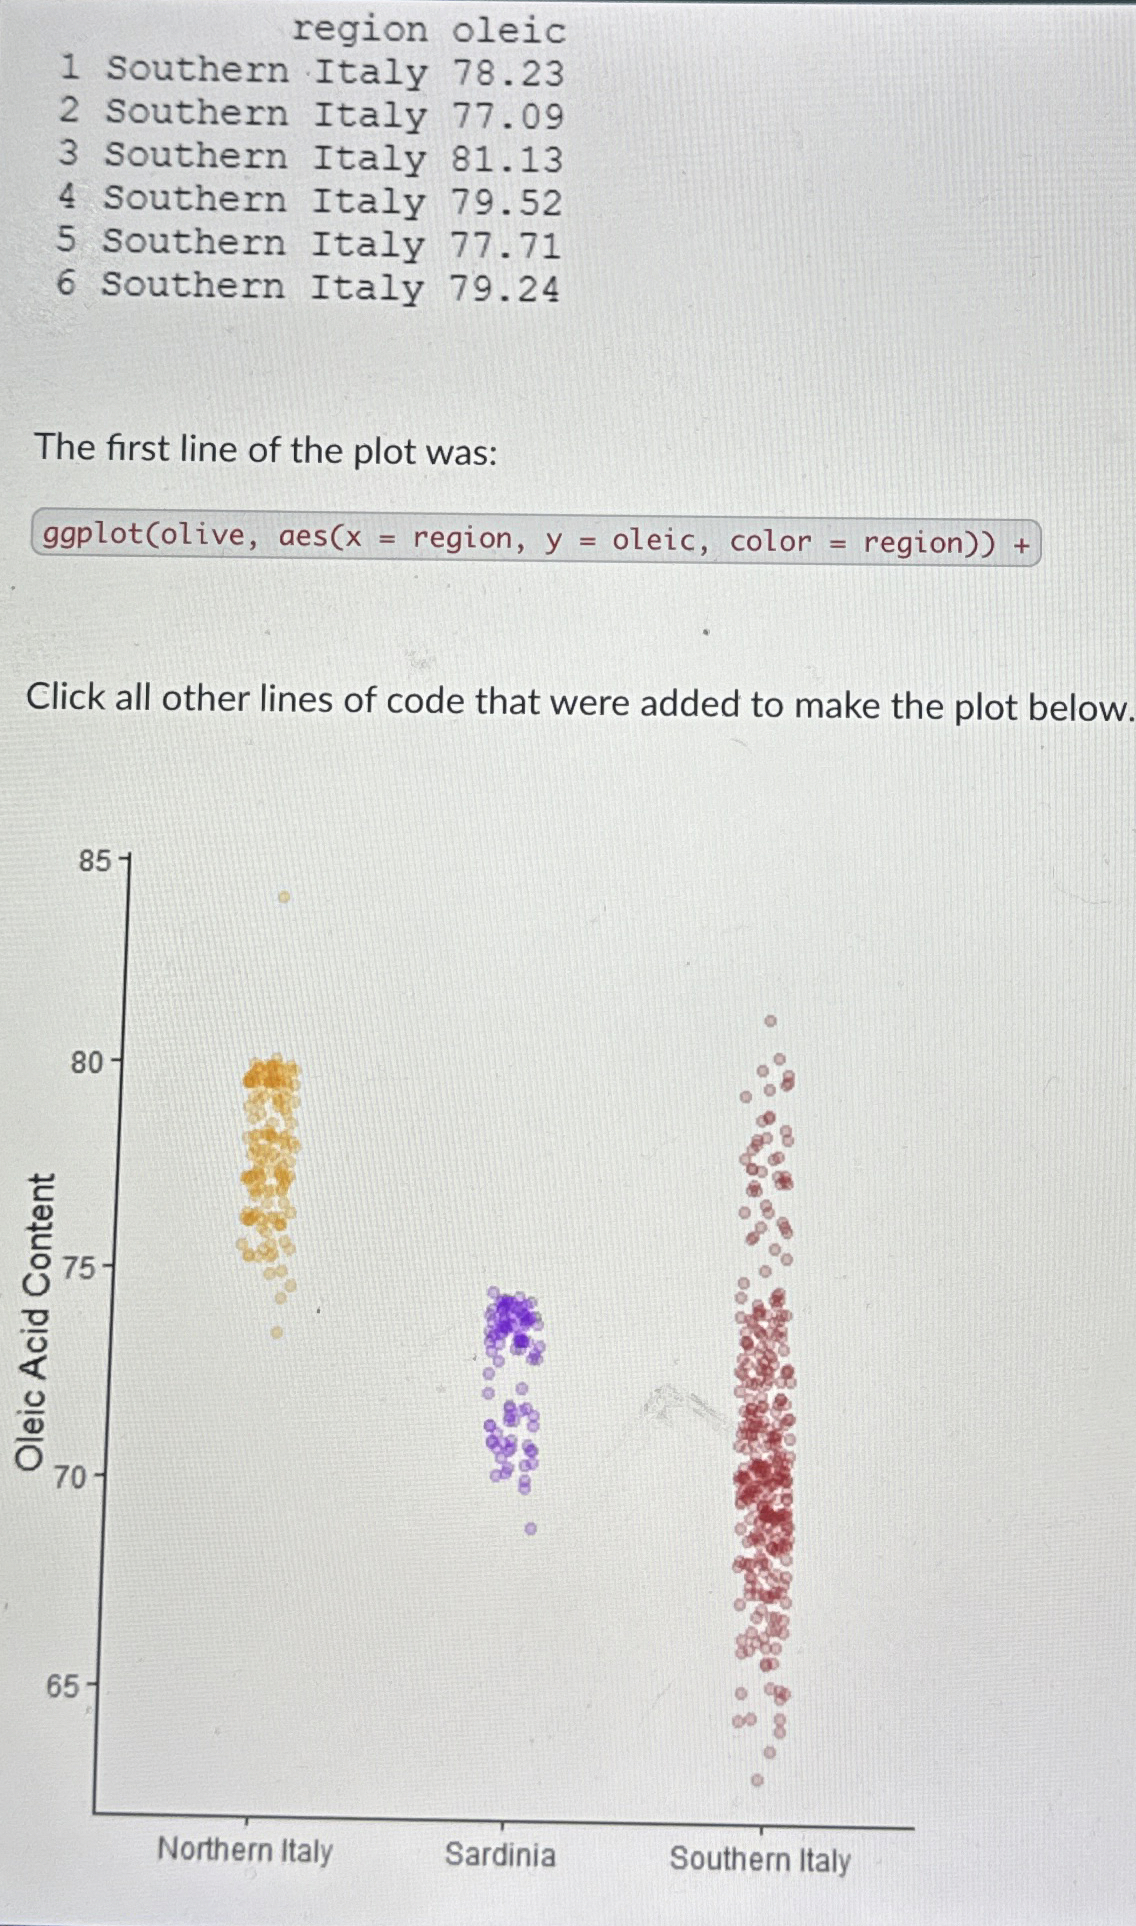
RSTUDIO Examine the strip plot. It's made from a dataset called olive. The first few rows are shown of this dataset.
region oleic
Southern Italy
Southern Italy
Southern Italy
Southern Italy
Southern Italy
Southern Italy
The first line of the plot was:
ggplotoliveaesxregion, oleic, color region
Click all other lines of code that were added to make the plot below.
A ylabOleic Acid Content"
B geompointalpha
C geomjitterwidth alpha
D geomboxplotfilloleic
E scalecolormanualvaluescorange "purple","firebrick"
F themeclassic
G xlab
Step by Step Solution
There are 3 Steps involved in it
1 Expert Approved Answer
Step: 1 Unlock

Question Has Been Solved by an Expert!
Get step-by-step solutions from verified subject matter experts
Step: 2 Unlock
Step: 3 Unlock