

Question: Rstudio Exercise 7.1 a. As closely as you can, re-create the following plot: SOMETHING PROFOUND .3 -2 b. With the following data, create a plot
Rstudio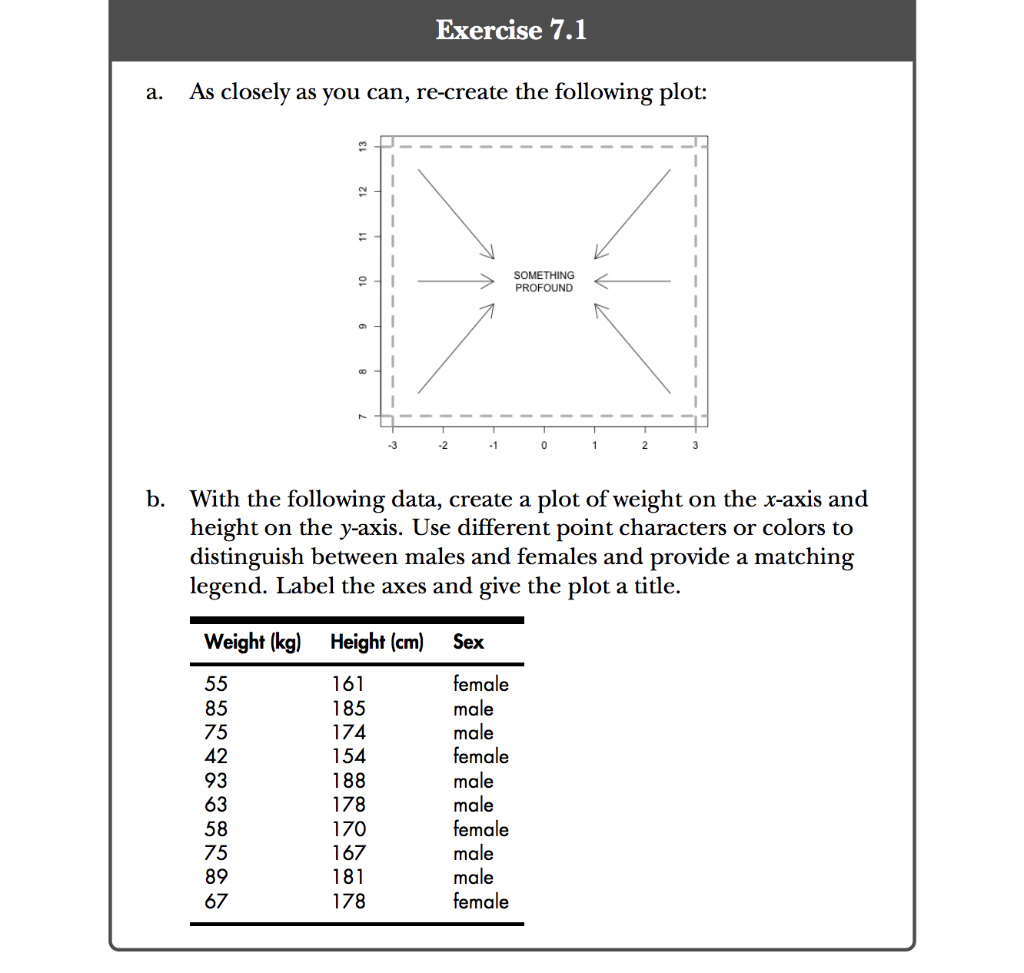
Exercise 7.1 a. As closely as you can, re-create the following plot: SOMETHING PROFOUND .3 -2 b. With the following data, create a plot of weight on the x-axis and height on the y-axis. Use different point characters or colors to distinguish between males and females and provide a matching legend. Label the axes and give the plot a title. Weight (kg) Height (cm) Sex 85 75 42 93 63 58 75 89 67 161 185 174 154 188 178 170 167 181 178 female male male female male male female male male female Exercise 7.1 a. As closely as you can, re-create the following plot: SOMETHING PROFOUND .3 -2 b. With the following data, create a plot of weight on the x-axis and height on the y-axis. Use different point characters or colors to distinguish between males and females and provide a matching legend. Label the axes and give the plot a title. Weight (kg) Height (cm) Sex 85 75 42 93 63 58 75 89 67 161 185 174 154 188 178 170 167 181 178 female male male female male male female male male female
Step by Step Solution
There are 3 Steps involved in it

Get step-by-step solutions from verified subject matter experts