

Question: Rstudio Part 2 . Data for part 2 comes from the Wikipedia page for the largest companies by revenue Data contains information on the 50
Rstudio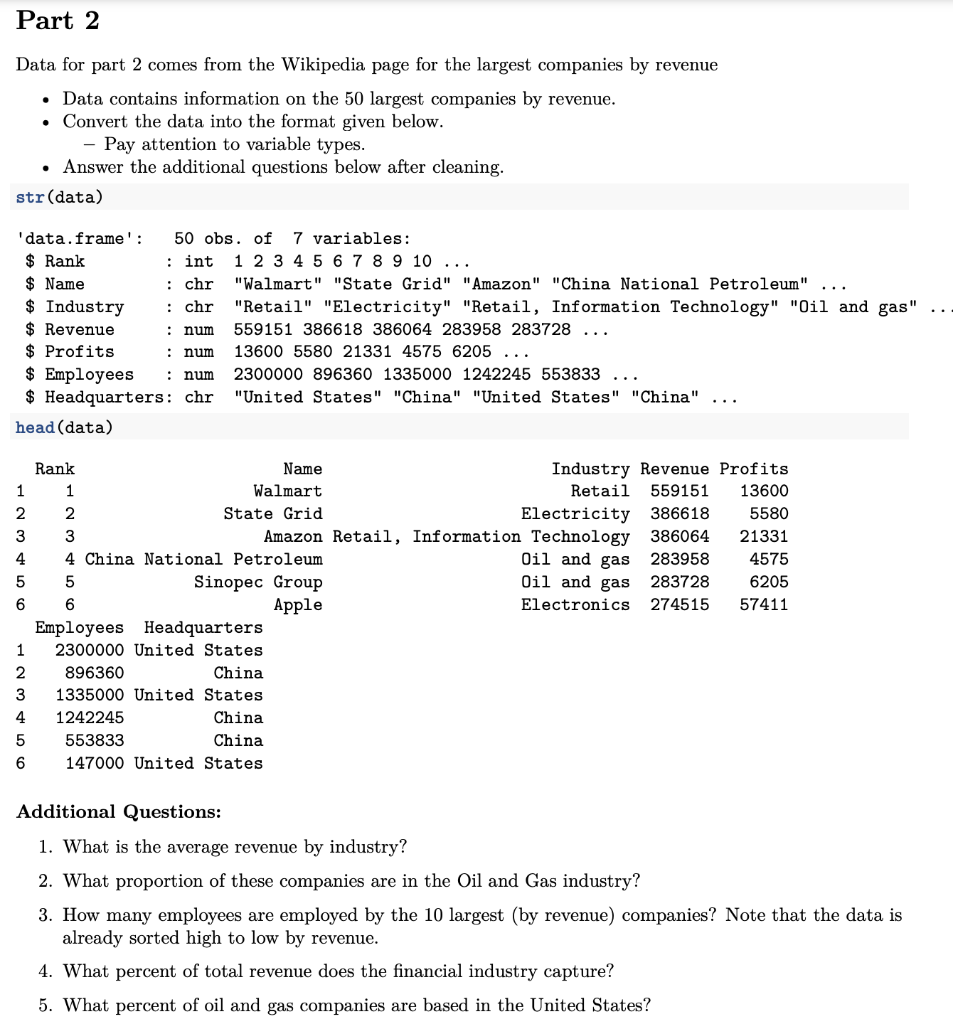
Part 2 . Data for part 2 comes from the Wikipedia page for the largest companies by revenue Data contains information on the 50 largest companies by revenue. Convert the data into the format given below. Pay attention to variable types. Answer the additional questions below after cleaning. str(data) 'data.frame': 50 obs. of 7 variables: $ Rank : int 1 2 3 4 5 6 7 8 9 10 ... $ Name : chr "Walmart" "State Grid" "Amazon" "China National Petroleum" $ Industry : chr "Retail" "Electricity" "Retail, Information Technology" "Oil and gas" $ Revenue : num 559151 386618 386064 283958 283728 $ Profits num 13600 5580 21331 4575 6205 ... $ Employees : num 2300000 896360 1335000 1242245 553833 $ Headquarters: chr "United States" "China" "United States" "China" head(data) 6205 Rank Name Industry Revenue Profits 1 1 Walmart Retail 559151 13600 2 2 State Grid Electricity 386618 5580 3 3 Amazon Retail, Information Technology 386064 21331 4 4 China National Petroleum Oil and gas 283958 4575 5 5 Sinopec Group Oil and gas 283728 6 6 Apple Electronics 274515 57411 Employees Headquarters 1 2300000 United States 2 896360 China 3 1335000 United States 4 1242245 China 5 553833 China 6 147000 United States Additional Questions: 1. What is the average revenue by industry? 2. What proportion of these companies are in the Oil and Gas industry? 3. How many employees are employed by the 10 largest (by revenue) companies? Note that the data is already sorted high to low by revenue. 4. What percent of total revenue does the financial industry capture? 5. What percent of oil and gas companies are based in the United States? Part 2 . Data for part 2 comes from the Wikipedia page for the largest companies by revenue Data contains information on the 50 largest companies by revenue. Convert the data into the format given below. Pay attention to variable types. Answer the additional questions below after cleaning. str(data) 'data.frame': 50 obs. of 7 variables: $ Rank : int 1 2 3 4 5 6 7 8 9 10 ... $ Name : chr "Walmart" "State Grid" "Amazon" "China National Petroleum" $ Industry : chr "Retail" "Electricity" "Retail, Information Technology" "Oil and gas" $ Revenue : num 559151 386618 386064 283958 283728 $ Profits num 13600 5580 21331 4575 6205 ... $ Employees : num 2300000 896360 1335000 1242245 553833 $ Headquarters: chr "United States" "China" "United States" "China" head(data) 6205 Rank Name Industry Revenue Profits 1 1 Walmart Retail 559151 13600 2 2 State Grid Electricity 386618 5580 3 3 Amazon Retail, Information Technology 386064 21331 4 4 China National Petroleum Oil and gas 283958 4575 5 5 Sinopec Group Oil and gas 283728 6 6 Apple Electronics 274515 57411 Employees Headquarters 1 2300000 United States 2 896360 China 3 1335000 United States 4 1242245 China 5 553833 China 6 147000 United States Additional Questions: 1. What is the average revenue by industry? 2. What proportion of these companies are in the Oil and Gas industry? 3. How many employees are employed by the 10 largest (by revenue) companies? Note that the data is already sorted high to low by revenue. 4. What percent of total revenue does the financial industry capture? 5. What percent of oil and gas companies are based in the United States
Step by Step Solution
There are 3 Steps involved in it

Get step-by-step solutions from verified subject matter experts