

Question: RSTUDIO/R PROGRAMMING PLEASE HELP EVEN WITH BASIC CODES ### Question 1: What is the dimension of the LifeTable data frame? Are there any variables (columns)
RSTUDIO/R PROGRAMMING PLEASE HELP EVEN WITH BASIC CODES

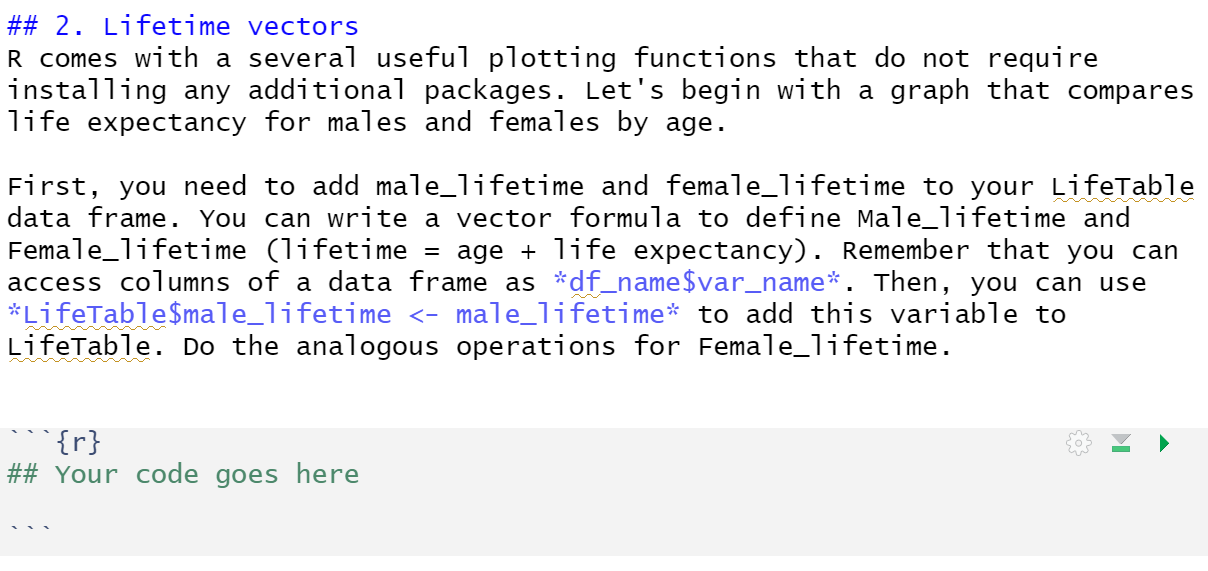
### Question 1: What is the dimension of the LifeTable data frame? Are there any variables (columns) that should be treated as factors (categorical variables)? ## 2. Lifetime vectors R comes with a several useful plotting functions that do not require installing any additional packages. Let's begin with a graph that compares life expectancy for males and females by age. First, you need to add male_lifetime and female_lifetime to your LifeTable data frame. You can write a vector formula to define Male_lifetime and Female_lifetime (lifetime = age + life expectancy). Remember that you can access columns of a data frame as *df_name $var_name*. Then, you can use *LifeTable$male_lifetime
Step by Step Solution
There are 3 Steps involved in it

Get step-by-step solutions from verified subject matter experts