

Question: Run a one-way ANOVA with Tukey post hoc analysis and interpret results (25 points total) Explain homogeneity of variance Explain Sum of square Interpret the
- Run a one-way ANOVA with Tukey post hoc analysis and interpret results (25 points total)
- Explain homogeneity of variance
- Explain Sum of square
- Interpret the f ratio, significance, and post hoc analysis.
- Provide written conclusion.
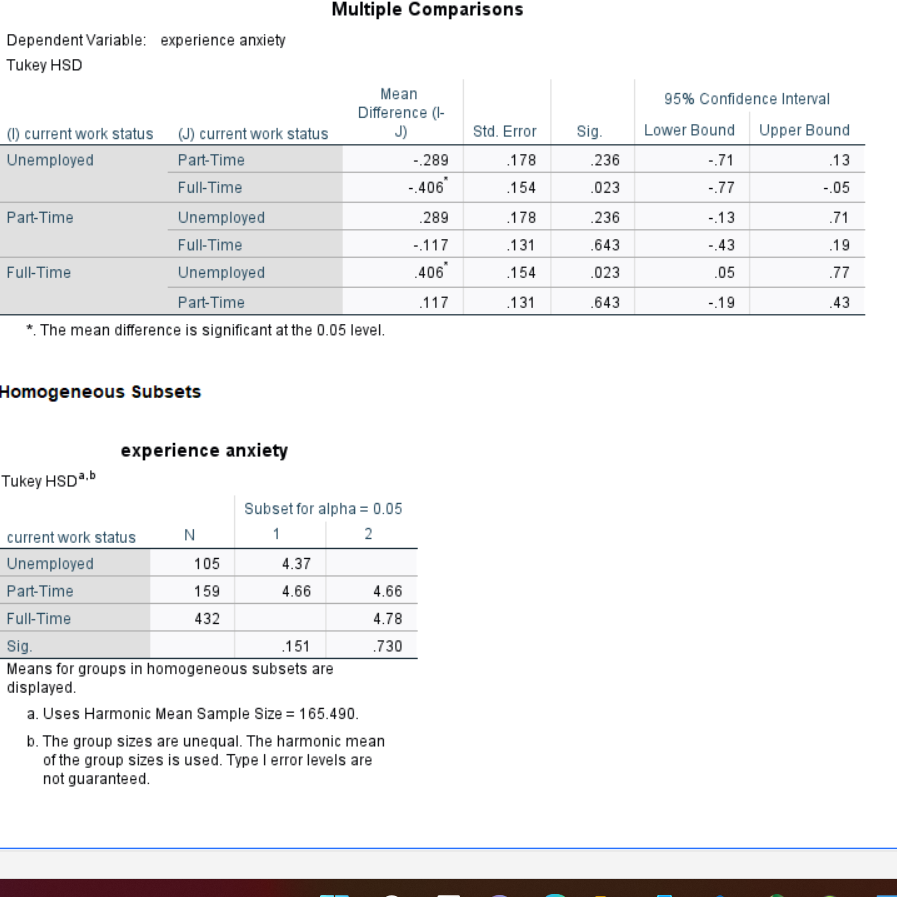
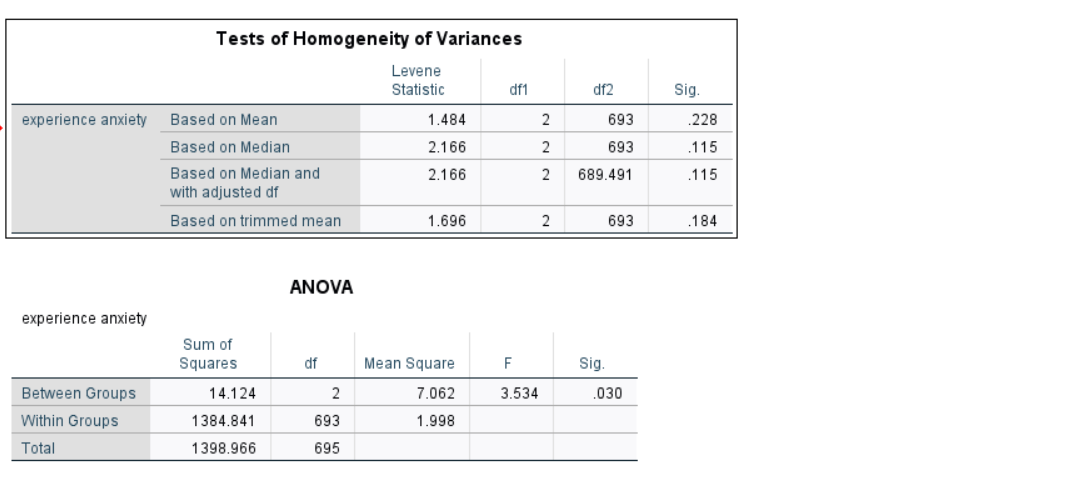
Multiple Comparisons Dependent Variable: experience anxiety Tukey HSD Mean 95% Confidence Interval Difference (1- (1) current work status (J) current work status J) Std. Error Sig Lower Bound Upper Bound Unemployed Part-Time .289 178 236 .71 13 Full-Time -.406 .154 023 -.77 -.05 Part-Time Unemployed 289 178 236 .13 71 Full-Time -.117 131 .643 .43 19 Full-Time Unemployed 406 154 023 05 .77 Part-Time 117 .131 .643 .19 43 *. The mean difference is significant at the 0.05 level. Homogeneous Subsets experience anxiety Tukey HSDa.b Subset for alpha = 0.05 current work status N 2 Unemployed 105 4.37 Part-Time 159 4.66 4.66 Full-Time 432 4.78 Sig. 151 730 Means for groups in homogeneous subsets are displayed. a. Uses Harmonic Mean Sample Size = 165.490. b. The group sizes are unequal. The harmonic mean of the group sizes is used. Type | error levels are not guaranteedTests of Homogeneity of Variances Levene Statistic if1 df2 Sig. experience anxiety Based on Mean 1.484 2 693 228 Based on Median 2.166 2 693 .115 Based on Median and 2.166 2 689.491 .115 with adjusted df Based on trimmed mean 1.696 2 693 .184 ANOVA experience anxiety Sum of Squares df Mean Square F Sig. Between Groups 14.124 2 7.062 3.534 030 Within Groups 1384.841 693 1.998 Total 1398.966 695
Step by Step Solution
There are 3 Steps involved in it

Get step-by-step solutions from verified subject matter experts