Question: Run an Anderson-Darling test for normaly Standard deviation and mean Figure Out the data and mean method of simply Histogram median simple based t owe
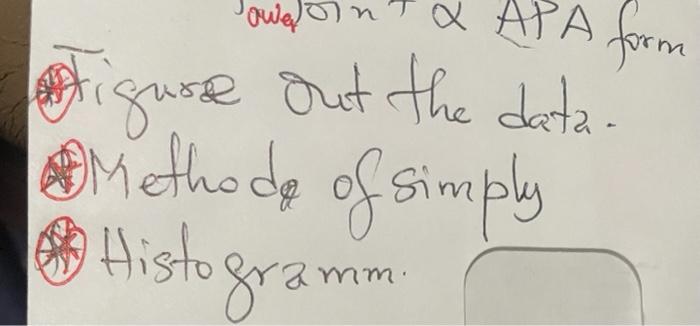
Run an Anderson-Darling test for normaly
Standard deviation and mean
Figure Out the data and mean
method of simply
Histogram
median simple based
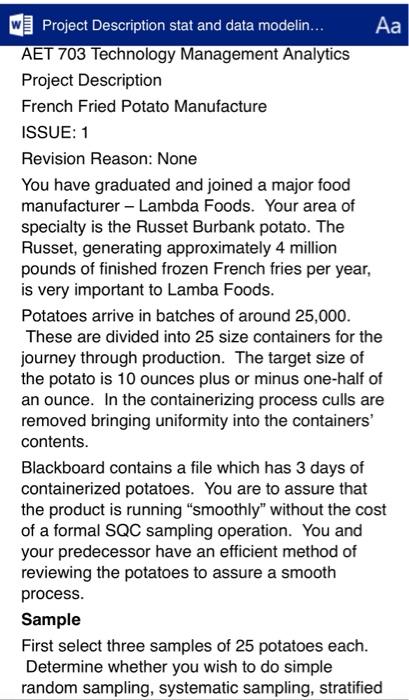
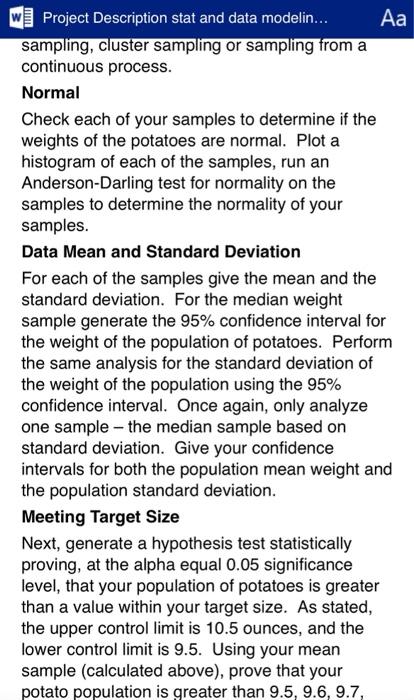
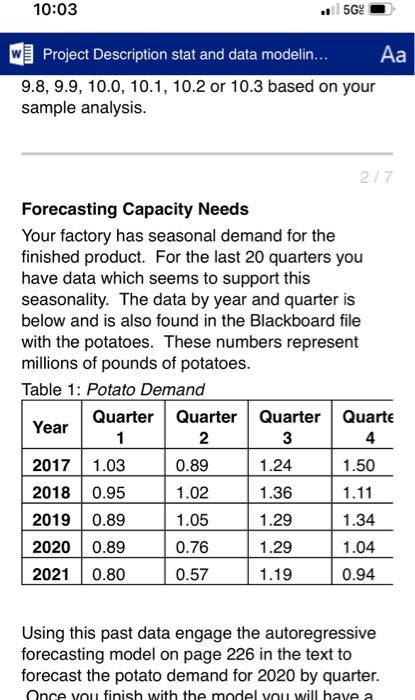
t owe on & APA form stigure out the data Methode of simply Histor g Histogra 2 mm. Project Description stat and data modelin... AET 703 Technology Management Analytics Project Description French Fried Potato Manufacture ISSUE: 1 Revision Reason: None You have graduated and joined a major food manufacturer - Lambda Foods. Your area of specialty is the Russet Burbank potato. The Russet, generating approximately 4 million pounds of finished frozen French fries per year, is very important to Lamba Foods. Potatoes arrive in batches of around 25,000. These are divided into 25 size containers for the journey through production. The target size of the potato is 10 ounces plus or minus one-half of an ounce. In the containerizing process culls are removed bringing uniformity into the containers' contents. Blackboard contains a file which has 3 days of containerized potatoes. You are to assure that the product is running "smoothly" without the cost of a formal SQC sampling operation. You and your predecessor have an efficient method of reviewing the potatoes to assure a smooth process. Sample First select three samples of 25 potatoes each. Determine whether you wish to do simple random sampling, systematic sampling, stratified Project Description stat and data modelin... sampling, cluster sampling or sampling from a continuous process. Normal Check each of your samples to determine if the weights of the potatoes are normal. Plot a histogram of each of the samples, run an Anderson-Darling test for normality on the samples to determine the normality of your samples. Data Mean and Standard Deviation For each of the samples give the mean and the standard deviation. For the median weight sample generate the 95% confidence interval for the weight of the population of potatoes. Perform the same analysis for the standard deviation of the weight of the population using the 95% confidence interval. Once again, only analyze one sample - the median sample based on standard deviation. Give your confidence intervals for both the population mean weight and the population standard deviation. Meeting Target Size Next, generate a hypothesis test statistically proving, at the alpha equal 0.05 significance level, that your population of potatoes is greater than a value within your target size. As stated, the upper control limit is 10.5 ounces, and the lower control limit is 9.5. Using your mean sample (calculated above), prove that your potato population is greater than 9.5, 9.6, 9.7, 10:03 ..5G! Project Description stat and data modelin... 9.8, 9.9, 10.0, 10.1, 10.2 or 10.3 based on your sample analysis. 2/7 Forecasting Capacity Needs Your factory has seasonal demand for the finished product. For the last 20 quarters you have data which seems to support this seasonality. The data by year and quarter is below and is also found in the Blackboard file with the potatoes. These numbers represent millions of pounds of potatoes. Table 1: Potato Demand Quarter Quarter Quarter Quarte Year 1 2 3 4 2017 1.03 0.89 1.24 1.50 2018 0.95 1.02 1.36 1.11 2019 0.89 1.05 1.29 1.34 20200.89 0.76 1.29 1.04 2021 0.80 0.57 1.19 0.94 Using this past data engage the autoregressive forecasting model on page 226 in the text to forecast the potato demand for 2020 by quarter. Once you finish with the model you will have a Project Description stat and data modelin... predict potato demand. Plot both the actual demand and the forecasted demand. Quality of Forecast Use your equation to "back fill" the previous five years' data and test the quality of your forecast. Use the following format for your output Table 2: Forecast Format Did your model violate any of the limits on the tracking signal? What is your forecast in pounds for quarter one, two, three and four for year 2022? What are your total forecasted potatoes processed for next year? Summary Summarize all of the findings and decisions for this manufacturing operation. Your team will be required to present findings in PowerPoint and generate at least a 10-page APA formatted paper. The paper must include the summary sheet (attached) which requests critical data from the project. The attached rubric will be used to score your project. Please become familiar with the rubric. Enjoy this project. The project will help you to understand some of the principles learned in the statistics and data modeling class that you will be faced upon graduation