

Question: Run the regression analysis using ABC Corp's returns as Y- axis values and S&P 500 index returns as X-axis values. Report the results in the
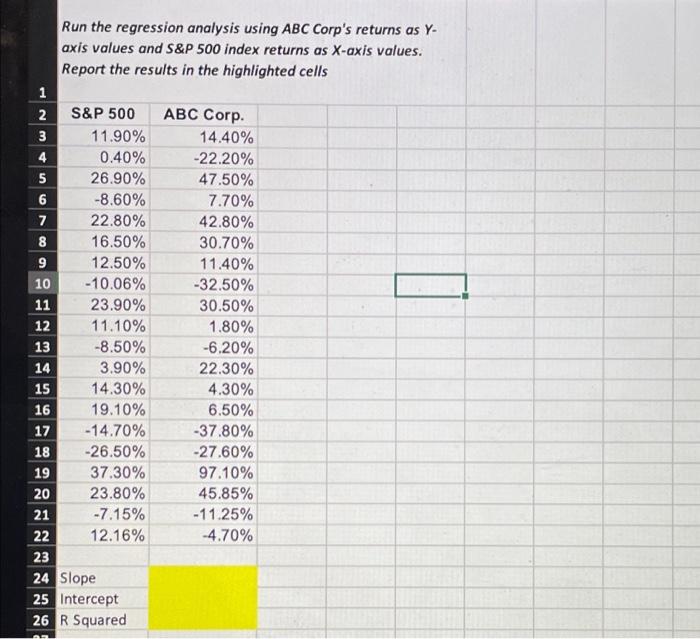
Run the regression analysis using ABC Corp's returns as Y- axis values and S&P 500 index returns as X-axis values. Report the results in the highlighted cells 1 2 S&P 500 ABC Corp. 3 11.90% 14.40% 4 0.40% -22.20% 5 26.90% 47.50% 6 -8.60% 7.70% 7 22.80% 42.80% 8 16.50% 30.70% 9 12.50% 11.40% 10 -10.06% -32.50% 11 23.90% 30.50% 11.10% 1.80% 13 -8.50% -6.20% 14 3.90% 22.30% 15 14.30% 4.30% 16 19.10% 6.50% 17 -14.70% -37.80% 18 -26.50% -27.60% 19 37.30% 97.10% 20 23.80% 45.85% 21 -7.15% - 11.25% 22 12.16% -4.70% 23 24 Slope 25 Intercept 26 R Squared 12
Step by Step Solution
There are 3 Steps involved in it
1 Expert Approved Answer
Step: 1 Unlock

Question Has Been Solved by an Expert!
Get step-by-step solutions from verified subject matter experts
Step: 2 Unlock
Step: 3 Unlock