

Question: # Run this cell first. Do NOT edit this cell. Answer 1 = Answer 2 = Answer 3 = Answer 4 = Answer 5 =
# Run this cell first. Do NOT edit this cell.
Answer Answer Answer Answer Answer Answer None
import pandas
import numpy
import matplotlib
import matplotlib.pyplot as plt
#omatplotlib inline
from sklearn. linearmodel import LinearRegression
elect pandas. readcsvUSCountyLevelPresidentialResults.csv
county pandas.readcsvCountydemographics.csv
state pandas. readcsvStateNameDatacsv
elect.shape, county.shape, state.shape
Problem
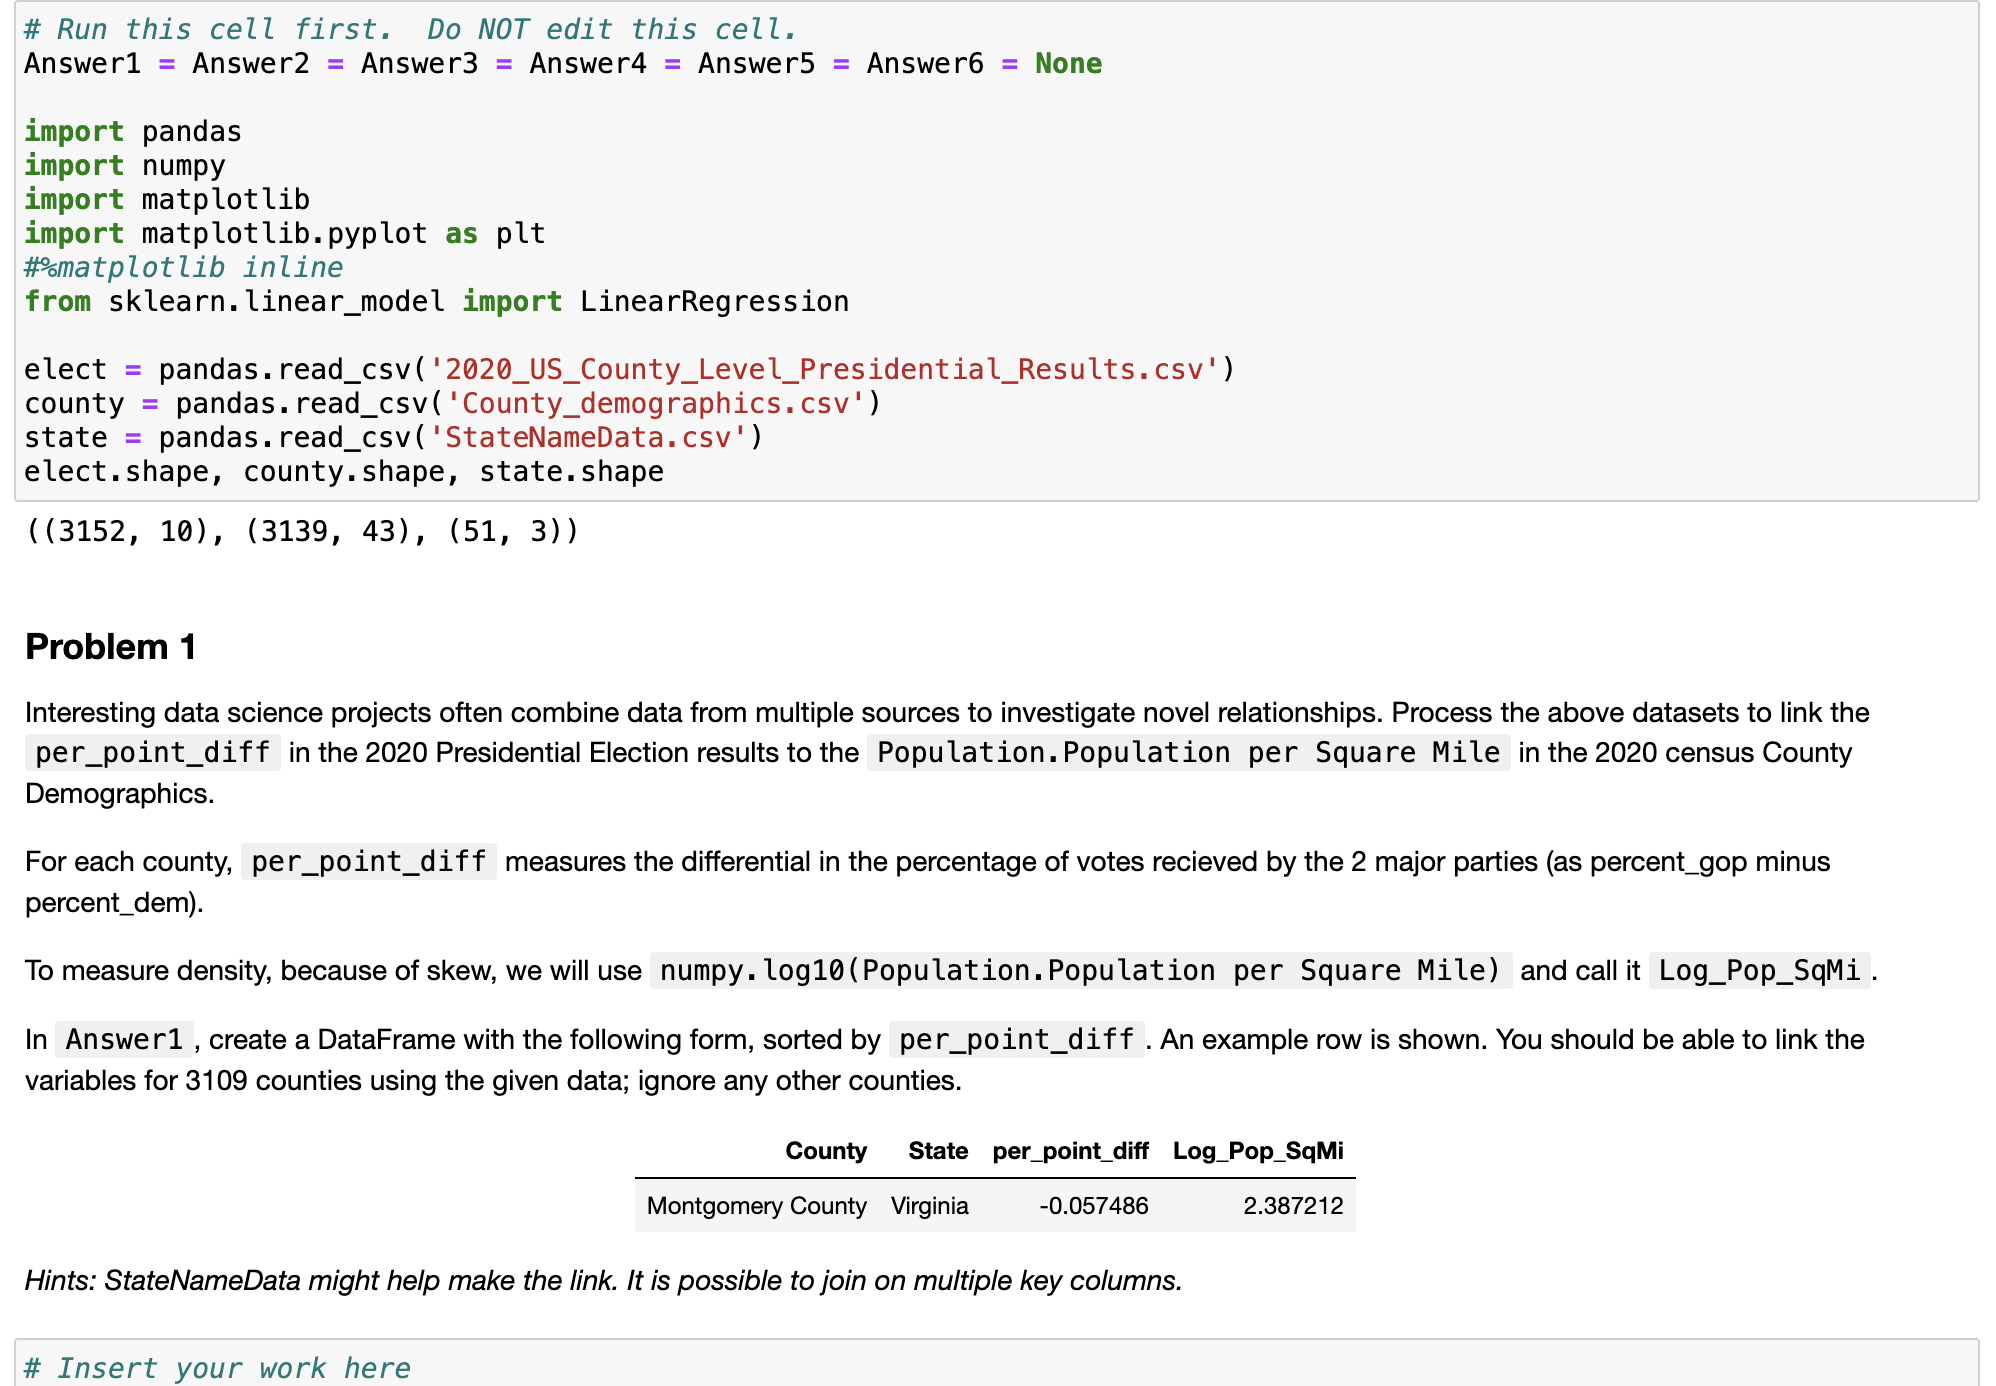
Interesting data science projects often combine data from multiple sources to investigate novel relationships. Process the above datasets to link the
perpointdiff in the Presidential Election results to the Population.Population per Square Mile in the census County
Demographics.
For each county, perpointdiff measures the differential in the percentage of votes recieved by the major parties as percentgop minus
percentdem
To measure density, because of skew, we will use numpy. PopulationPopulation per Square Mile and call it LogPopSqMi.
In Answer create a DataFrame with the following form, sorted by perpointdiff An example row is shown. You should be able to link the
variables for counties using the given data; ignore any other counties.
Hints: StateNameData might help make the link. It is possible to join on multiple key columns.
Step by Step Solution
There are 3 Steps involved in it
1 Expert Approved Answer
Step: 1 Unlock

Question Has Been Solved by an Expert!
Get step-by-step solutions from verified subject matter experts
Step: 2 Unlock
Step: 3 Unlock