

Question: s 12) Comparative financial statement data for Dorman Company and Martin Company, two competitors in the same industry, appear below. All balance sheet data are
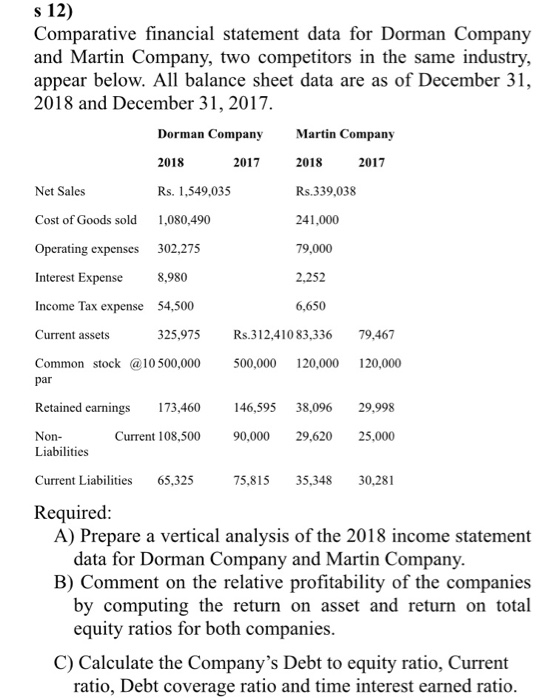
s 12) Comparative financial statement data for Dorman Company and Martin Company, two competitors in the same industry, appear below. All balance sheet data are as of December 31, 2018 and December 31, 2017. Dorman Company Martin Company 2018 2017 2018 2017 Net Sales Rs. 1,549,035 Rs.339,038 Cost of Goods sold 1,080,490 241,000 Operating expenses 302,275 79,000 Interest Expense 8,980 2,252 Income Tax expense 54,500 6,650 Current assets 325,975 Rs.312,41083,336 79,467 Common stock @ 10 500,000 500,000 120,000 120,000 par Retained earnings 173,460 146,595 38,096 29,998 Non Current 108,500 90,000 29,620 25,000 Liabilities Current Liabilities 65,325 75,815 35,348 30,281 Required: A) Prepare a vertical analysis of the 2018 income statement data for Dorman Company and Martin Company. B) Comment on the relative profitability of the companies by computing the return on asset and return on total equity ratios for both companies. C) Calculate the Company's Debt to equity ratio, Current ratio, Debt coverage ratio and time interest earned ratio
Step by Step Solution
There are 3 Steps involved in it

Get step-by-step solutions from verified subject matter experts