

Question: S 4 3 2 Make a graph with the 5 data points from your results. Draw a curve of the best fit for these
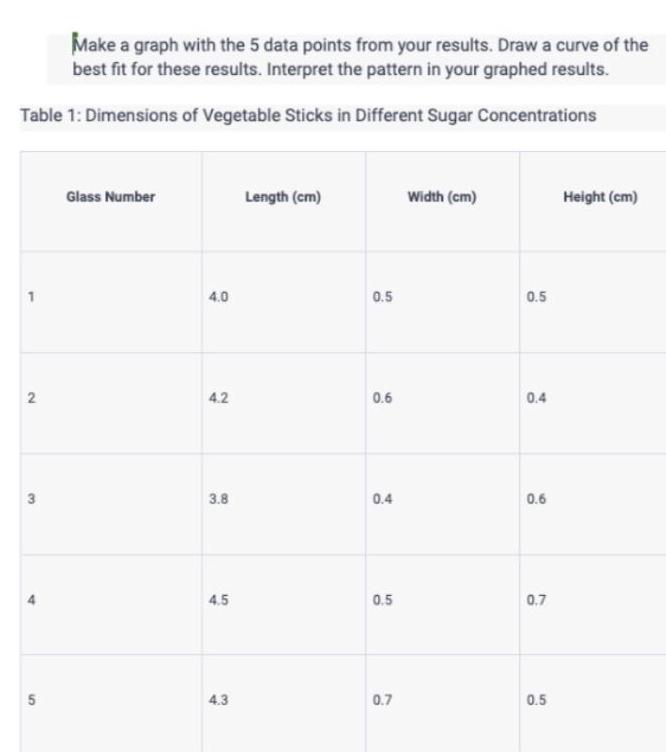
S 4 3 2 Make a graph with the 5 data points from your results. Draw a curve of the best fit for these results. Interpret the pattern in your graphed results. Table 1: Dimensions of Vegetable Sticks in Different Sugar Concentrations Glass Number Length (cm) Width (cm) Height (cm) 4.0 0.5 0.5 4.2 0.6 0.4 3.8 0.4 0.6 4.5 0.5 0.7 40 4.3 0.7 0.5
Step by Step Solution
There are 3 Steps involved in it
1 Expert Approved Answer
Step: 1 Unlock

Question Has Been Solved by an Expert!
Get step-by-step solutions from verified subject matter experts
Step: 2 Unlock
Step: 3 Unlock