

Question: S 46 40 30 24 100 150 The graph shown portrays a subsidy to buyers. The post subsidy price received by sellers for each unk
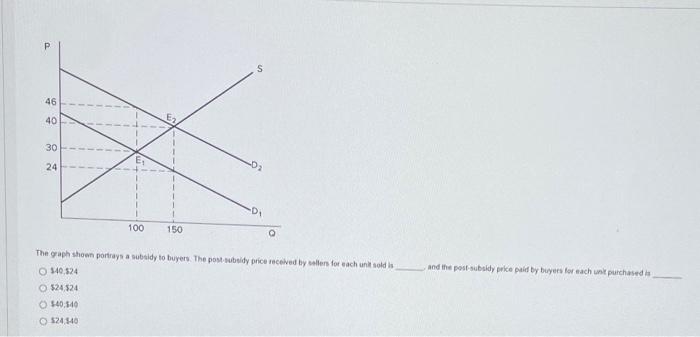

S 46 40 30 24 100 150 The graph shown portrays a subsidy to buyers. The post subsidy price received by sellers for each unk sold is and the post subsidy price paid by buyers for each unk purchased is 140,124 124, 124 9 124,148
Step by Step Solution
There are 3 Steps involved in it
1 Expert Approved Answer
Step: 1 Unlock

Question Has Been Solved by an Expert!
Get step-by-step solutions from verified subject matter experts
Step: 2 Unlock
Step: 3 Unlock