

Question: S al year 1: year 2: O D D Q /+ S Q /t 6) year 1: year 2: D Q /t c) year 1:

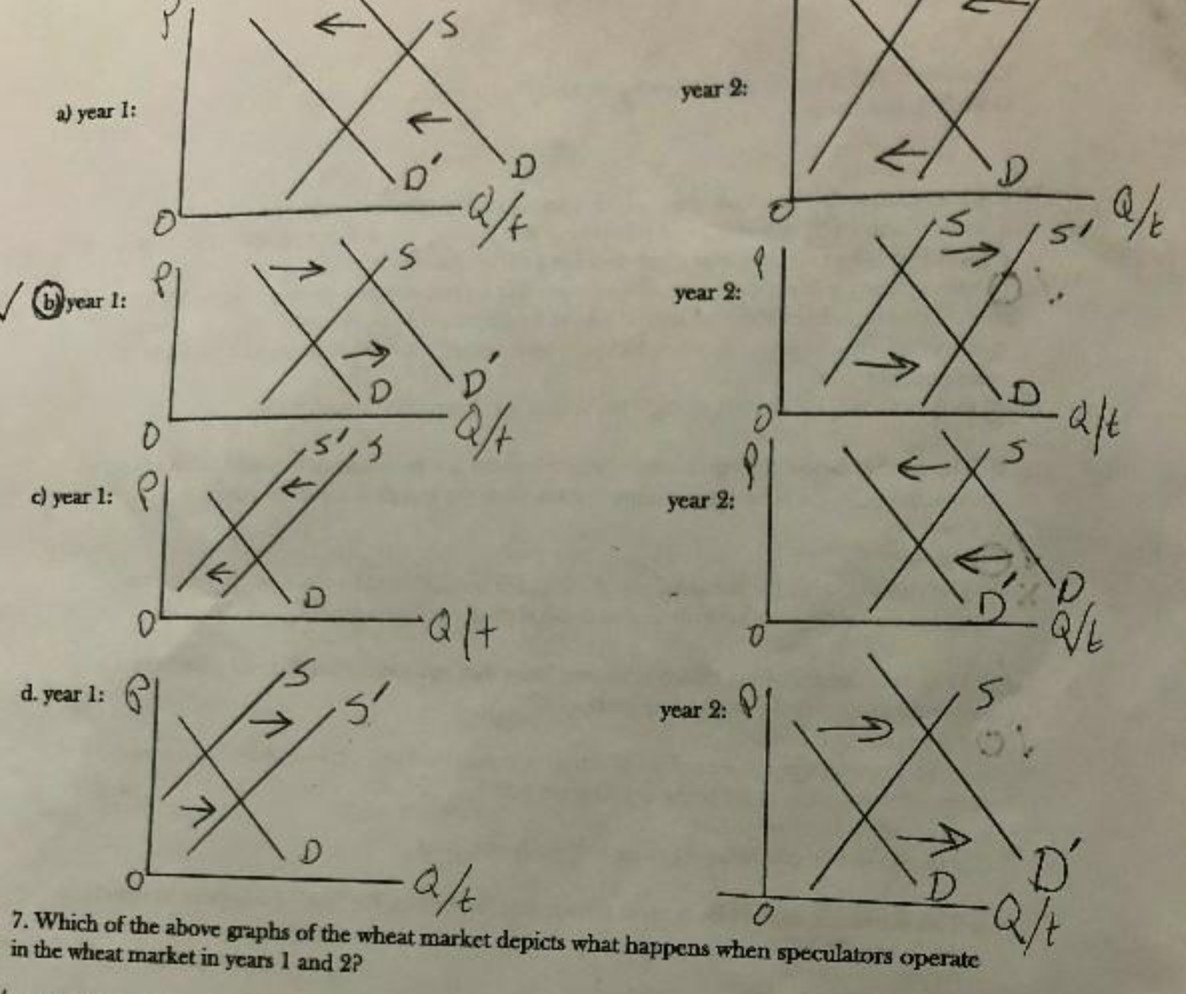
S al year 1: year 2: O D D Q /+ S Q /t 6) year 1: year 2: D Q /t c) year 1: 15 year 2: D alt D d. year 1: year 2: 5 D 2/t 7. Which of the above graphs of the wheat market depicts what happens when speculators operate in the wheat market in years I and 2
Step by Step Solution
There are 3 Steps involved in it
1 Expert Approved Answer
Step: 1 Unlock

Question Has Been Solved by an Expert!
Get step-by-step solutions from verified subject matter experts
Step: 2 Unlock
Step: 3 Unlock