

Question: s). (Apply R to this question, R markdown formal is requested) There is a random sample: sample: 4.52, 1.02, 0.27, 10.38, 13.04. -4.10, 8.21. -0.64,
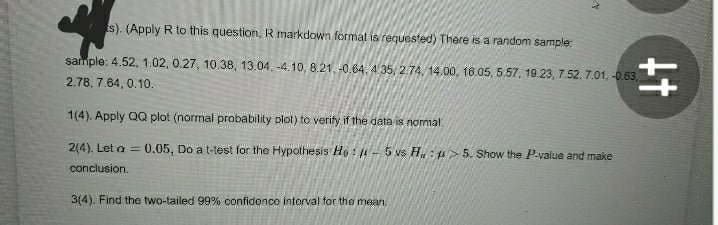
s). (Apply R to this question, R markdown formal is requested) There is a random sample: sample: 4.52, 1.02, 0.27, 10.38, 13.04. -4.10, 8.21. -0.64, 4 35/ 2 74, 14.00, 16.05, 5.57, 19.23, 7.52. 7.01, -0.63 + 2.78. 7.64, 0.10. 1(4). Apply QQ plot (normal probability plot) to verity if the date is normal 2(4). Let a = 0.05, Do a t-test for the Hypothesis Ho : /1 - 5 vs H, : " > 5. Show the /-value and makes conclusion. 3(4). Find the two-tailed 99% confidence interval for the mean
Step by Step Solution
There are 3 Steps involved in it
1 Expert Approved Answer
Step: 1 Unlock

Question Has Been Solved by an Expert!
Get step-by-step solutions from verified subject matter experts
Step: 2 Unlock
Step: 3 Unlock