

Question: S6B-1. Can someone show me how to do this problem? Will rate a thumb up for good response thanks so much (PLEASE CIRCLE OR HIGHLIGHT
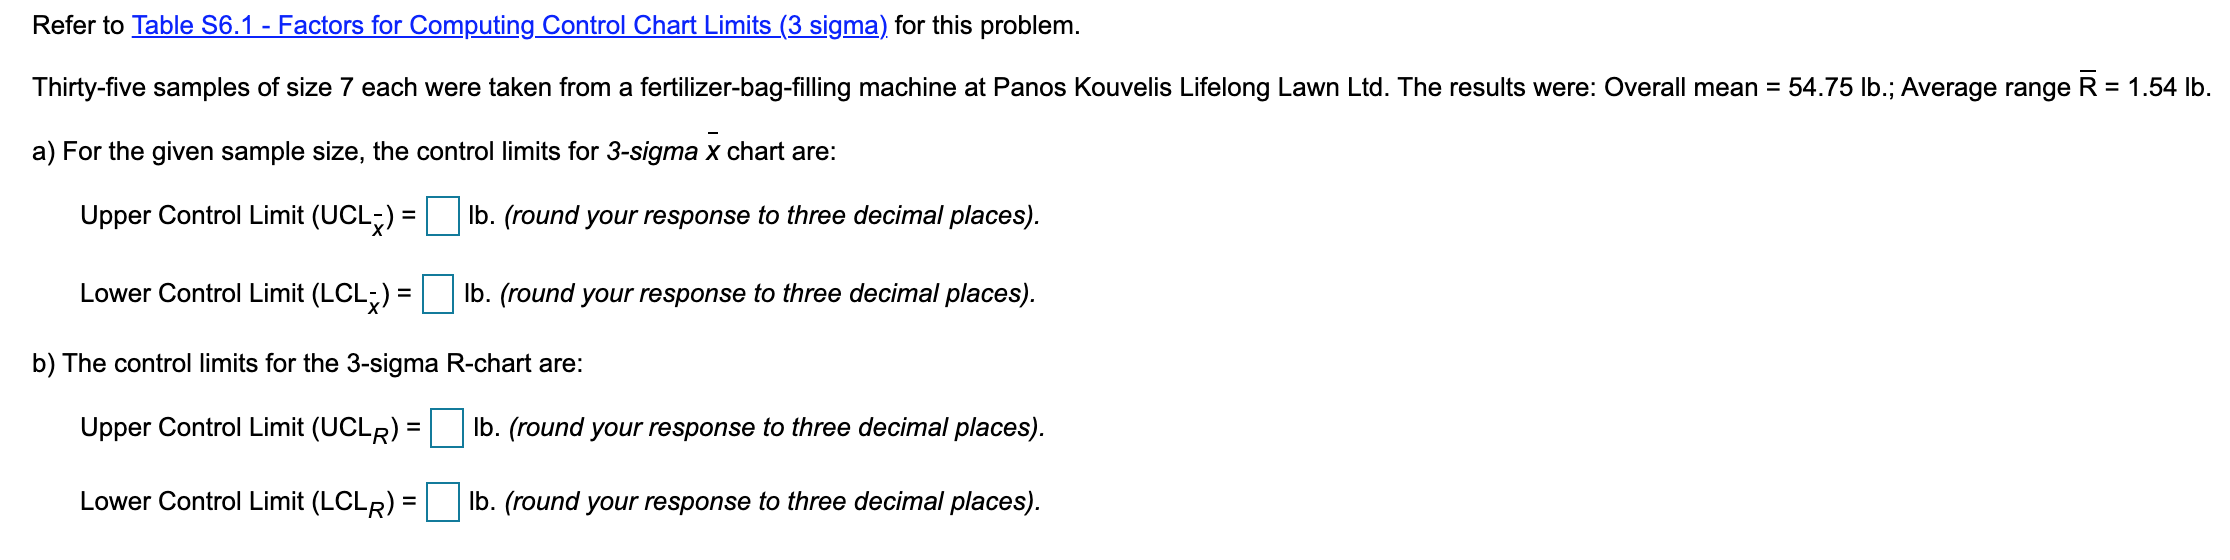
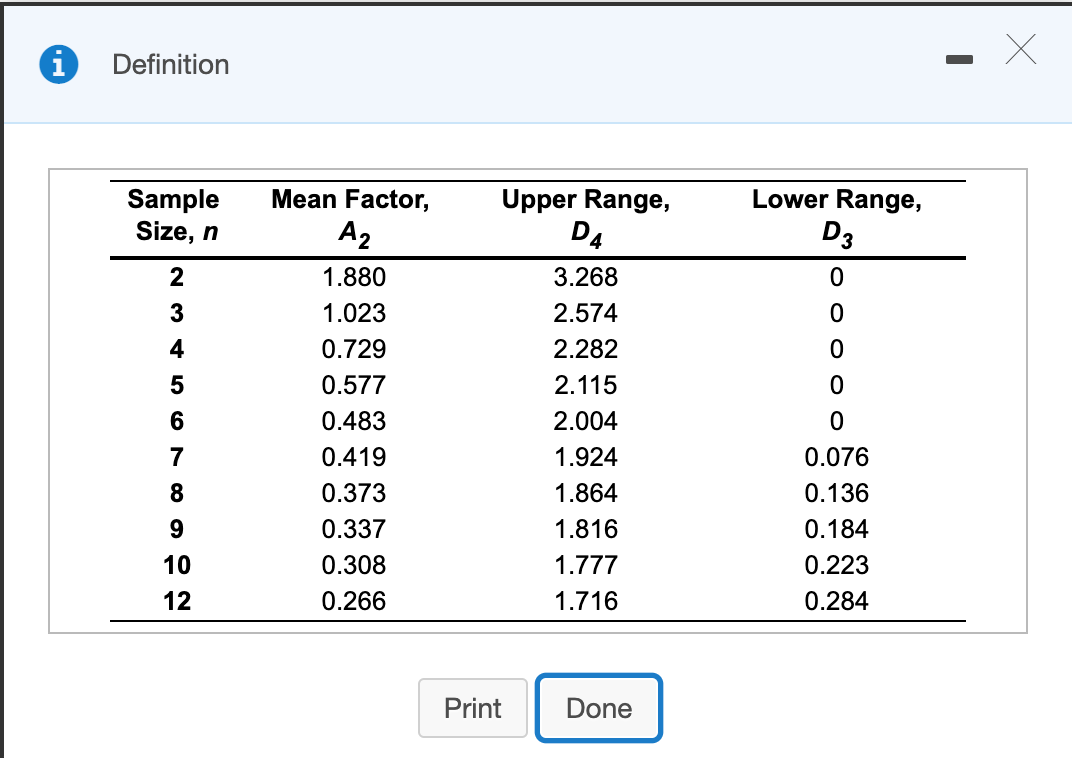
S6B-1. Can someone show me how to do this problem?
Will rate a thumb up for good response thanks so much (PLEASE CIRCLE OR HIGHLIGHT final answer thx)
Step by Step Solution
There are 3 Steps involved in it
1 Expert Approved Answer
Step: 1 Unlock

Question Has Been Solved by an Expert!
Get step-by-step solutions from verified subject matter experts
Step: 2 Unlock
Step: 3 Unlock