

Question: safety stock work template Submit on using the template provided You work for a global sporting goods manufactures, and are reviewing your ordering process for
safety stock work
template
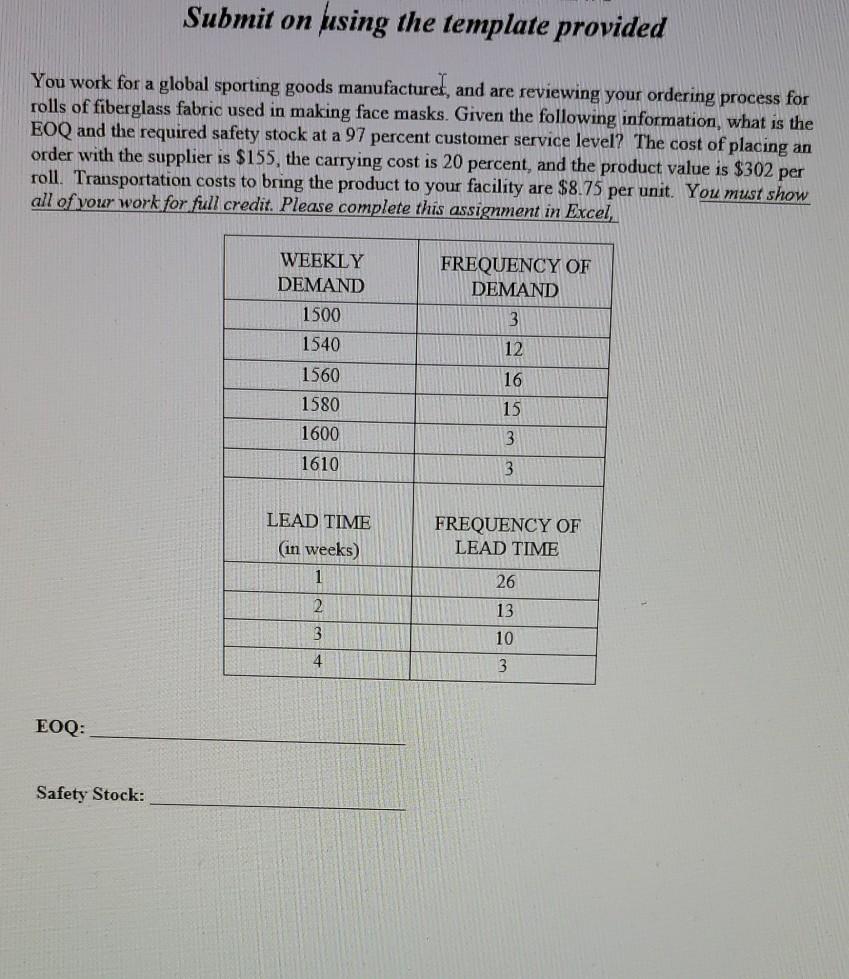
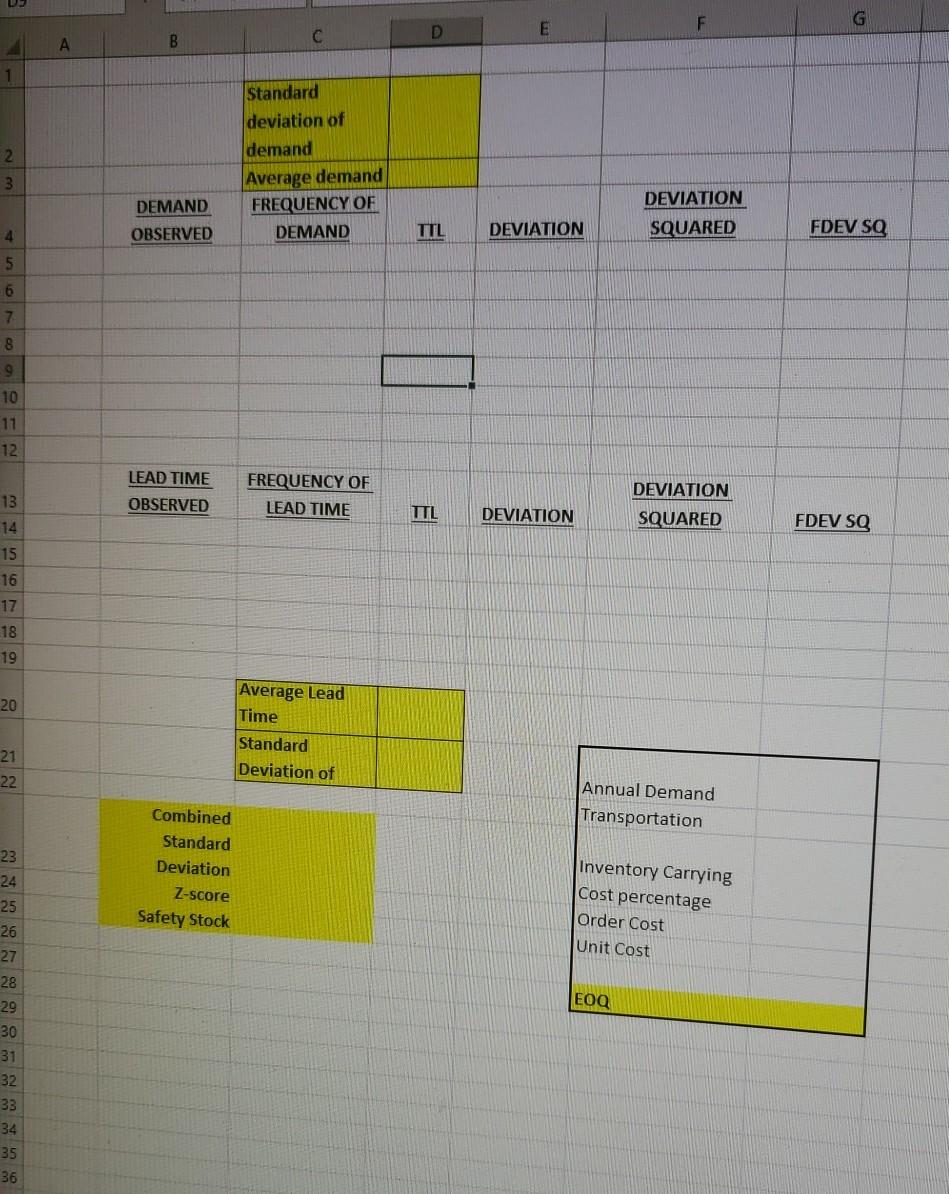
Submit on using the template provided You work for a global sporting goods manufactures, and are reviewing your ordering process for rolls of fiberglass fabric used in making face masks. Given the following information, what is the EOQ and the required safety stock at a 97 percent customer service level? The cost of placing an order with the supplier is $155, the carrying cost is 20 percent, and the product value is $302 per roll. Transportation costs to bring the product to your facility are $8.75 per unit. You must show all of your work for full credit. Please complete this assignment in Excel, WEEKLY DEMAND FREQUENCY OF DEMAND 3 12 1500 1540 1560 1580 1600 16 15 1610 3 3 LEAD TIME (in weeks) 1 FREQUENCY OF LEAD TIME 26 2 13 3 10 4 3 EOQ: Safety Stock: F G E D C B 1 2. 3 Standard deviation of demand Average demand FREQUENCY OF DEMAND DEMAND OBSERVED DEVIATION SQUARED 4 TTL DEVIATION FDEV SO 5 6 7 8 9 10 11 12 LEAD TIME FREQUENCY OF LEAD TIME DEVIATION OBSERVED TTL DEVIATION SQUARED FDEV SO 13 14 15 16 17 18 19 20 Average Lead Time Standard Deviation of 21 22 Annual Demand Transportation Combined Standard Deviation Z-score Safety Stock Inventory Carrying Cost percentage Order Cost Unit Cost EOQ 23 24 25 26 27 28 29 30 31 32 33 34 35 36 Submit on using the template provided You work for a global sporting goods manufactures, and are reviewing your ordering process for rolls of fiberglass fabric used in making face masks. Given the following information, what is the EOQ and the required safety stock at a 97 percent customer service level? The cost of placing an order with the supplier is $155, the carrying cost is 20 percent, and the product value is $302 per roll. Transportation costs to bring the product to your facility are $8.75 per unit. You must show all of your work for full credit. Please complete this assignment in Excel, WEEKLY DEMAND FREQUENCY OF DEMAND 3 12 1500 1540 1560 1580 1600 16 15 1610 3 3 LEAD TIME (in weeks) 1 FREQUENCY OF LEAD TIME 26 2 13 3 10 4 3 EOQ: Safety Stock: F G E D C B 1 2. 3 Standard deviation of demand Average demand FREQUENCY OF DEMAND DEMAND OBSERVED DEVIATION SQUARED 4 TTL DEVIATION FDEV SO 5 6 7 8 9 10 11 12 LEAD TIME FREQUENCY OF LEAD TIME DEVIATION OBSERVED TTL DEVIATION SQUARED FDEV SO 13 14 15 16 17 18 19 20 Average Lead Time Standard Deviation of 21 22 Annual Demand Transportation Combined Standard Deviation Z-score Safety Stock Inventory Carrying Cost percentage Order Cost Unit Cost EOQ 23 24 25 26 27 28 29 30 31 32 33 34 35 36
Step by Step Solution
There are 3 Steps involved in it

Get step-by-step solutions from verified subject matter experts