

Question: Sales Bar Chart Write a program that asks the user to enter today's sales for five stores. The program should then display a bar graph
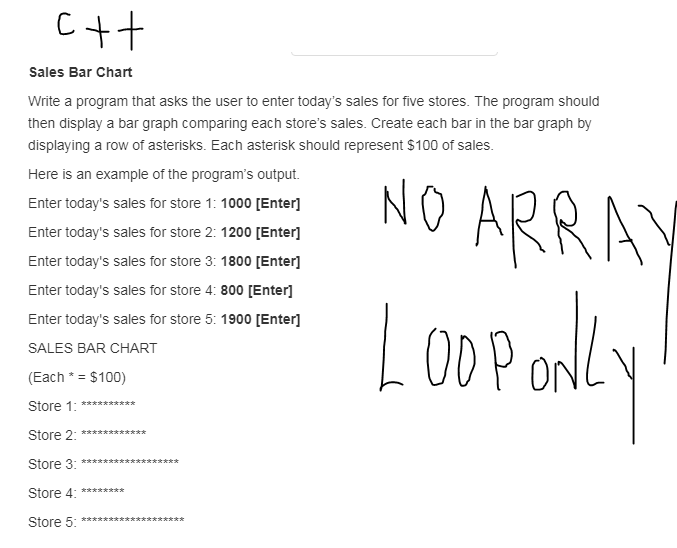
Sales Bar Chart Write a program that asks the user to enter today's sales for five stores. The program should then display a bar graph comparing each store's sales. Create each bar in the bar graph by displaying a row of asterisks. Each asterisk should represent $100 of sales. Here is an example of the program's output. Enter today's sales for store 1:1000 [Enter] Enter today's sales for store 2: 1200 [Enter Enter today's sales for store 3: 1800 [Enter] Enter today's sales for store 4: 800 [Enter] Enter today's sales for store 5: 1900 [Enter] SALES BAR CHART (Each * = $100) Store 1 Store 2: Store 3: Store 4:* Store 5: NO ARRAY
Step by Step Solution
There are 3 Steps involved in it
1 Expert Approved Answer
Step: 1 Unlock

Question Has Been Solved by an Expert!
Get step-by-step solutions from verified subject matter experts
Step: 2 Unlock
Step: 3 Unlock