

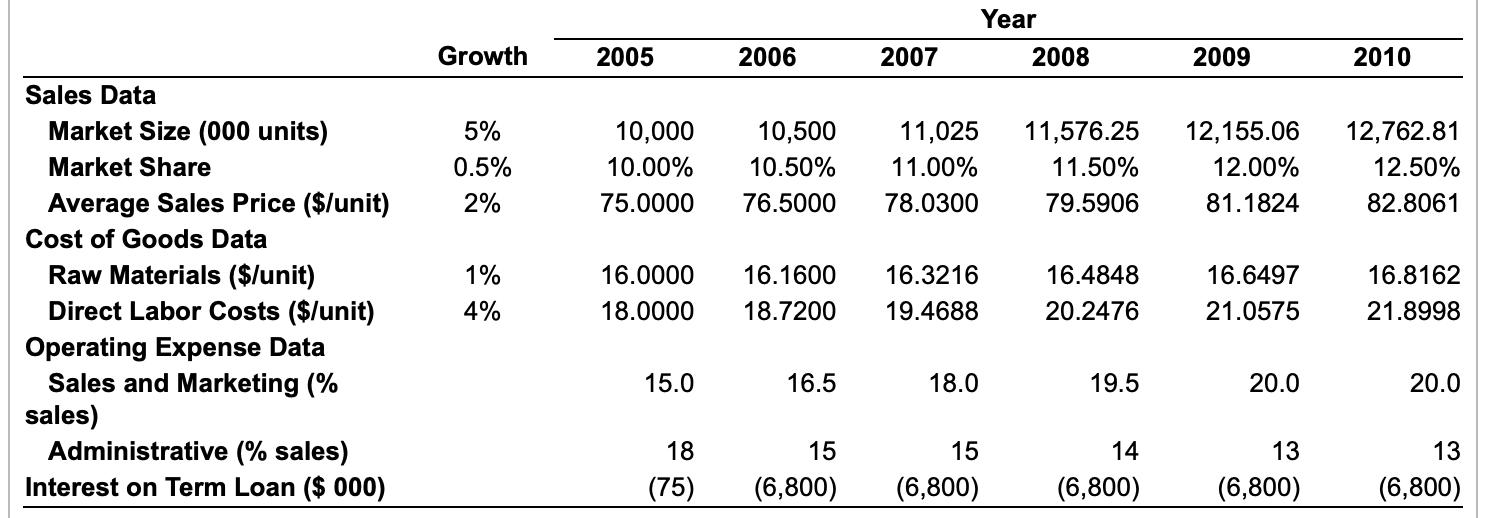
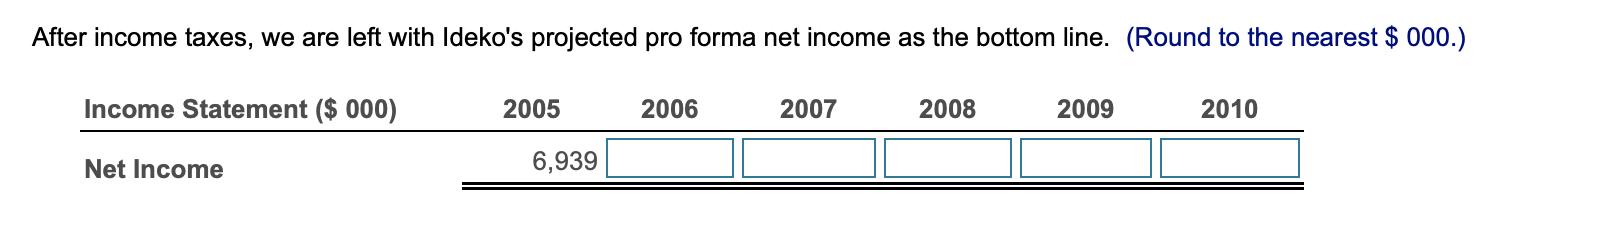
Sales Data Market Size (000 units) Market Share Average Sales Price ($/unit) Cost of Goods Data...
Fantastic news! We've Found the answer you've been seeking!
Question:
Transcribed Image Text:
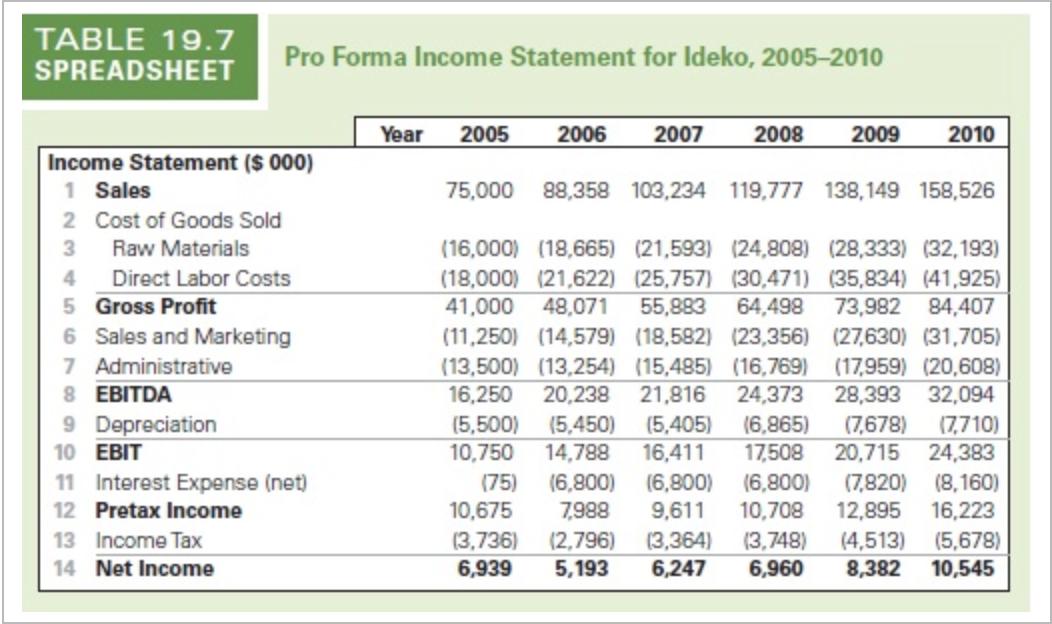
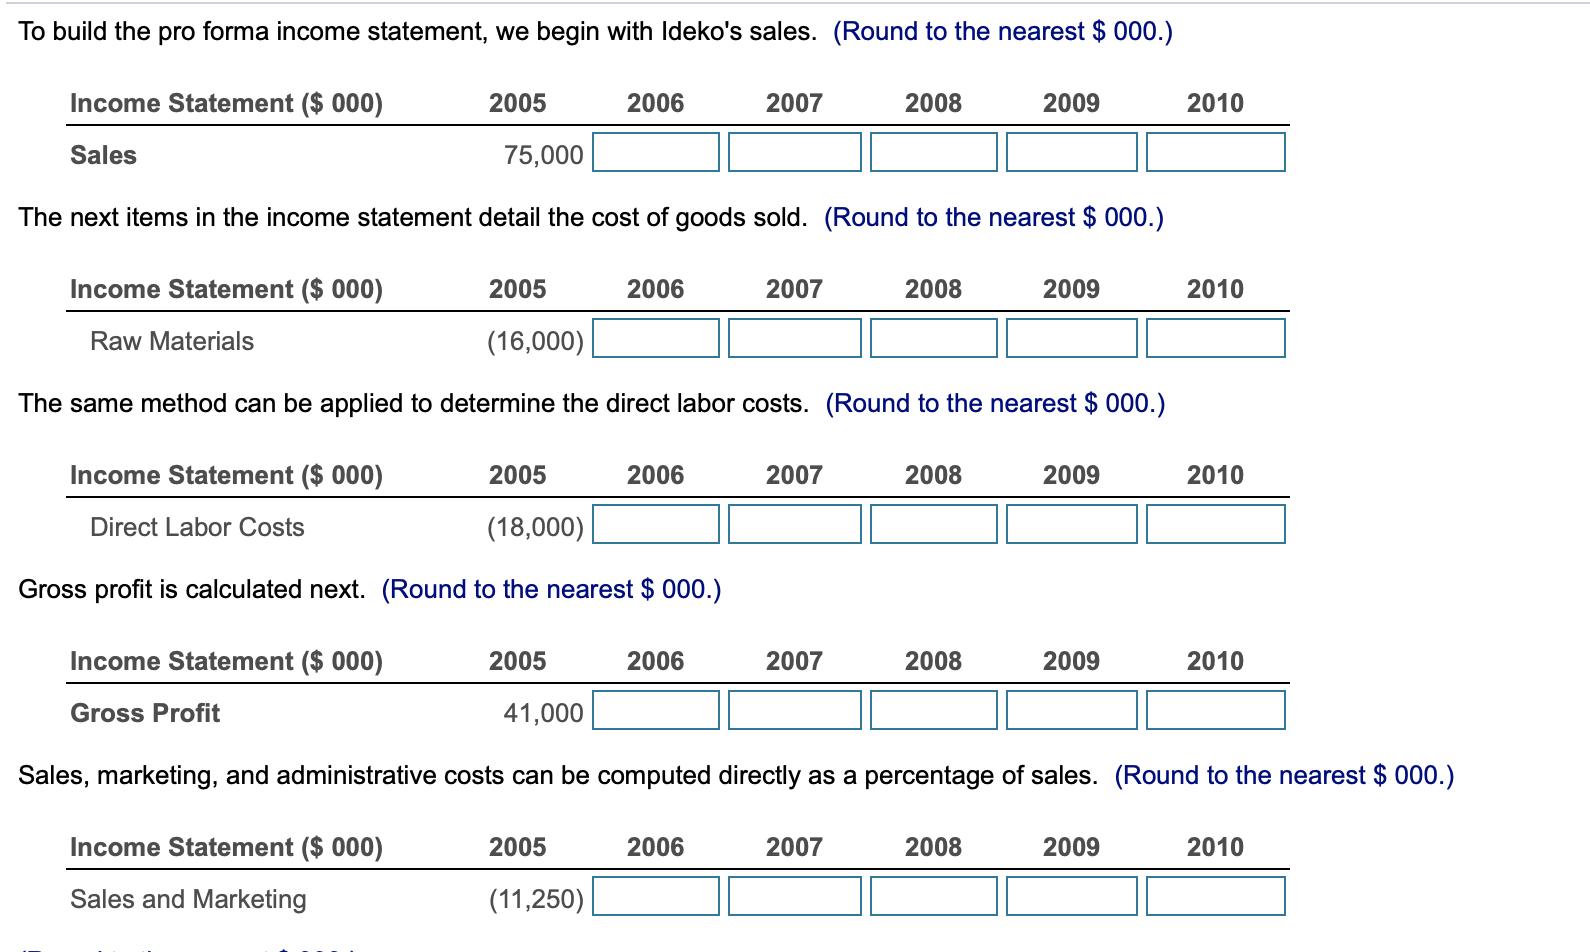
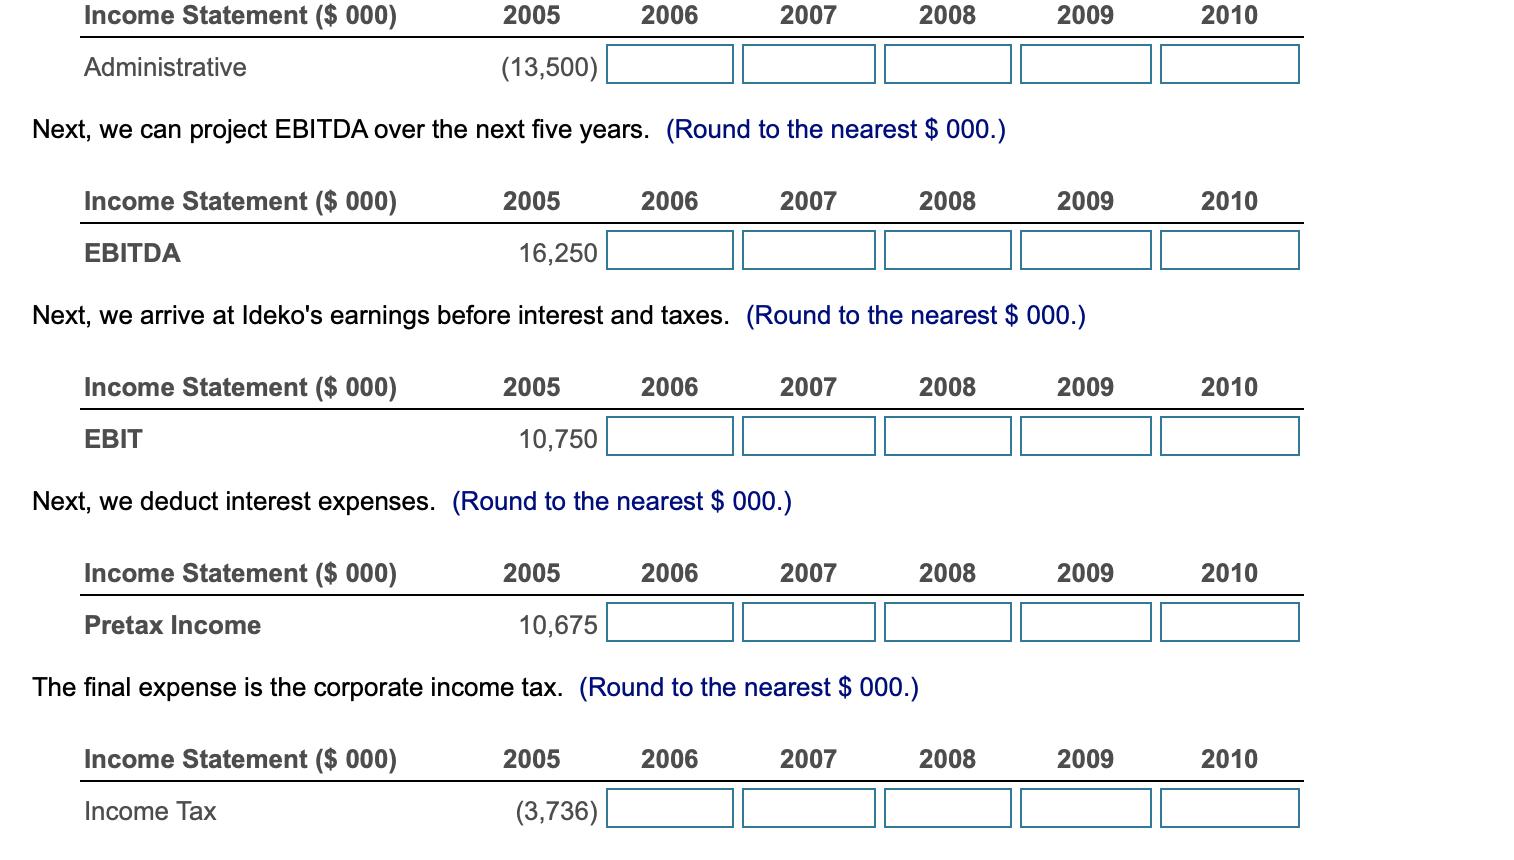
Sales Data Market Size (000 units) Market Share Average Sales Price ($/unit) Cost of Goods Data Raw Materials ($/unit) Direct Labor Costs ($/unit) Operating Expense Data Sales and Marketing (% sales) Administrative (% sales) Interest on Term Loan ($ 000) Growth 5% 0.5% 2% 1% 4% 2005 16.0000 18.0000 15.0 2006 18 (75) 10,000 10,500 11,025 11,576.25 10.00% 10.50% 11.00% 11.50% 75.0000 76.5000 78.0300 79.5906 2007 16.1600 16.3216 18.7200 19.4688 16.5 15 (6,800) 18.0 Year 15 (6,800) 2008 16.4848 20.2476 19.5 14 (6,800) 2009 12,155.06 12.00% 81.1824 16.6497 21.0575 20.0 13 (6,800) 2010 12,762.81 12.50% 82.8061 16.8162 21.8998 20.0 13 (6,800) TABLE 19.7 SPREADSHEET Pro Forma Income Statement for Ideko, 2005-2010 Income Statement ($ 000) 1 Sales 2 Cost of Goods Sold 3 Raw Materials 4 Direct Labor Costs 5 Gross Profit 6 Sales and Marketing 7 Administrative 8 EBITDA 9 Depreciation 10 EBIT 11 Interest Expense (net) 12 Pretax Income 13 Income Tax 14 Net Income Year 2005 75,000 2006 2007 2008 2009 2010 88,358 103,234 119,777 138,149 158,526 (16,000) (18,665) (21,593) (24,808) (28,333) (32,193) (18,000) (21,622) (25,757) (30,471) (35,834) (41,925) 41,000 48,071 55,883 64,498 73,982 84,407 (11,250) (14,579) (18,582) (23,356) (27,630) (31,705) (13,500) (13,254) (15,485) (16,769) (17,959) (20,608) 16,250 20,238 21,816 24,373 28,393 32,094 (5,500) (5,450) (5,405) (6,865) (7,678) (7,710) 10,750 14,788 16,411 17,508 20,715 24,383 (6,800) (6,800) (7,820) (8,160) (75) (6,800) 10,675 7,988 9,611 10,708 12,895 16,223 (3,736) (2,796) (3,364) (3,748) (4,513) (5,678) 6,939 5,193 6,247 6,960 8,382 10,545 To build the pro forma income statement, we begin with Ideko's sales. (Round to the nearest $ 000.) Income Statement ($ 000) Sales Income Statement ($ 000) Direct Labor Costs 2005 Income Statement ($ 000) Gross Profit 75,000 The next items in the income statement detail the cost of goods sold. (Round to the nearest $ 000.) Income Statement ($ 000) Raw Materials The same method can be applied to determine the direct labor costs. (Round to the nearest $ 000.) 2005 (16,000) Income Statement ($ 000) Sales and Marketing 2005 2006 (18,000) Gross profit is calculated next. (Round to the nearest $ 000.) 2005 2006 2005 (11,250) 2006 2007 2006 2006 2007 2007 2008 2007 2007 2008 2008 2009 2008 2008 2009 2009 2009 41,000 Sales, marketing, and administrative costs can be computed directly as a percentage of sales. (Round to the nearest $ 000.) 2010 2009 2010 2010 2010 2010 Income Statement ($ 000) 2005 (13,500) Next, we can project EBITDA over the next five years. (Round to the nearest $ 000.) Administrative Income Statement ($ 000) EBITDA Income Statement ($ 000) EBIT Next, we deduct interest expenses. Income Statement ($ 000) Pretax Income 2005 Income Statement ($ 000) Income Tax 2005 2005 2006 10,675 16,250 Next, we arrive at Ideko's earnings before interest and taxes. (Round to the nearest $ 000.) 2006 2005 (3,736) 2006 10,750 (Round to the nearest $ 000.) 2007 2006 2007 2006 2007 2008 2007 The final expense is the corporate income tax. (Round to the nearest $ 000.) 2008 2007 2008 2008 2009 2008 2009 2009 2009 2009 2010 2010 2010 2010 2010 After income taxes, we are left with Ideko's projected pro forma net income as the bottom line. (Round to the nearest $ 000.) Income Statement ($ 000) Net Income 2005 6,939 2006 2007 2008 2009 2010 Sales Data Market Size (000 units) Market Share Average Sales Price ($/unit) Cost of Goods Data Raw Materials ($/unit) Direct Labor Costs ($/unit) Operating Expense Data Sales and Marketing (% sales) Administrative (% sales) Interest on Term Loan ($ 000) Growth 5% 0.5% 2% 1% 4% 2005 16.0000 18.0000 15.0 2006 18 (75) 10,000 10,500 11,025 11,576.25 10.00% 10.50% 11.00% 11.50% 75.0000 76.5000 78.0300 79.5906 2007 16.1600 16.3216 18.7200 19.4688 16.5 15 (6,800) 18.0 Year 15 (6,800) 2008 16.4848 20.2476 19.5 14 (6,800) 2009 12,155.06 12.00% 81.1824 16.6497 21.0575 20.0 13 (6,800) 2010 12,762.81 12.50% 82.8061 16.8162 21.8998 20.0 13 (6,800) TABLE 19.7 SPREADSHEET Pro Forma Income Statement for Ideko, 2005-2010 Income Statement ($ 000) 1 Sales 2 Cost of Goods Sold 3 Raw Materials 4 Direct Labor Costs 5 Gross Profit 6 Sales and Marketing 7 Administrative 8 EBITDA 9 Depreciation 10 EBIT 11 Interest Expense (net) 12 Pretax Income 13 Income Tax 14 Net Income Year 2005 75,000 2006 2007 2008 2009 2010 88,358 103,234 119,777 138,149 158,526 (16,000) (18,665) (21,593) (24,808) (28,333) (32,193) (18,000) (21,622) (25,757) (30,471) (35,834) (41,925) 41,000 48,071 55,883 64,498 73,982 84,407 (11,250) (14,579) (18,582) (23,356) (27,630) (31,705) (13,500) (13,254) (15,485) (16,769) (17,959) (20,608) 16,250 20,238 21,816 24,373 28,393 32,094 (5,500) (5,450) (5,405) (6,865) (7,678) (7,710) 10,750 14,788 16,411 17,508 20,715 24,383 (6,800) (6,800) (7,820) (8,160) (75) (6,800) 10,675 7,988 9,611 10,708 12,895 16,223 (3,736) (2,796) (3,364) (3,748) (4,513) (5,678) 6,939 5,193 6,247 6,960 8,382 10,545 To build the pro forma income statement, we begin with Ideko's sales. (Round to the nearest $ 000.) Income Statement ($ 000) Sales Income Statement ($ 000) Direct Labor Costs 2005 Income Statement ($ 000) Gross Profit 75,000 The next items in the income statement detail the cost of goods sold. (Round to the nearest $ 000.) Income Statement ($ 000) Raw Materials The same method can be applied to determine the direct labor costs. (Round to the nearest $ 000.) 2005 (16,000) Income Statement ($ 000) Sales and Marketing 2005 2006 (18,000) Gross profit is calculated next. (Round to the nearest $ 000.) 2005 2006 2005 (11,250) 2006 2007 2006 2006 2007 2007 2008 2007 2007 2008 2008 2009 2008 2008 2009 2009 2009 41,000 Sales, marketing, and administrative costs can be computed directly as a percentage of sales. (Round to the nearest $ 000.) 2010 2009 2010 2010 2010 2010 Income Statement ($ 000) 2005 (13,500) Next, we can project EBITDA over the next five years. (Round to the nearest $ 000.) Administrative Income Statement ($ 000) EBITDA Income Statement ($ 000) EBIT Next, we deduct interest expenses. Income Statement ($ 000) Pretax Income 2005 Income Statement ($ 000) Income Tax 2005 2005 2006 10,675 16,250 Next, we arrive at Ideko's earnings before interest and taxes. (Round to the nearest $ 000.) 2006 2005 (3,736) 2006 10,750 (Round to the nearest $ 000.) 2007 2006 2007 2006 2007 2008 2007 The final expense is the corporate income tax. (Round to the nearest $ 000.) 2008 2007 2008 2008 2009 2008 2009 2009 2009 2009 2010 2010 2010 2010 2010 After income taxes, we are left with Ideko's projected pro forma net income as the bottom line. (Round to the nearest $ 000.) Income Statement ($ 000) Net Income 2005 6,939 2006 2007 2008 2009 2010
Expert Answer:
Answer rating: 100% (QA)
It seems like youre asking for help in filling out a pro forma income statement for Ideko for the years 2006 to 2010 using the data provided in the gr... View the full answer

Related Book For 
Posted Date:
Students also viewed these finance questions
-
The following additional information is available for the Dr. Ivan and Irene Incisor family from Chapters 1-6. On December 12, Irene purchased the building where her store is located. She paid...
-
Jen and Berry's sells ice-creams from its factory-shop in Petone. There is a managing director (Maynard Dibble), a marketing manager (Mary Salman) and a production manager (Peter Pritchard). Maynard...
-
In this question, you are hired by Popper & Eciancio Partners (PE) to decide whether it is worthwhile to purchase a private firm, Matthew LLC. Matthew LLC produces a type of communicating watch with...
-
Construct a multilevel bill of material for product Z. How many Us are needed to make each Z? How many Ws are needed to make eachZ? Z. (2) (3) (2) (1) (1) (4)
-
Gerox Company applies manufacturing overhead on the basis of machine-hours, using a predetermined overhead rate. At the end of the current year, the Manufacturing Overhead account has a credit...
-
A maternal effect gene exists in a dominant N (functional) allele and a recessive n (nonfunctional) allele. What are the ratios of genotypes and phenotypes for the offspring of the following crosses?...
-
What is the difference between a transducer and a pickup?
-
The A-to-Z Office Supply Company is open from 8:00 A.M. to 6:00 P.M., and it receives 200 calls per day for delivery orders. It costs A-to-Z $20 to send out its trucks to make deliveries. The company...
-
Analyze the company's strategy and include 2 of these: expanded SWOT matrix, BCG matrix, IE matrix, or GSM.
-
Corrie wants to earn a net operating income of $10,000 this month. She currently sells her product for $50 each, has $10 of variable expense per product, and incurs $5,000 of fixed expenses. How many...
-
On January 3, 2020, FIN Company invested in a 7% bond with a principal amount of $600,000 issued by Z Company at a discount for $560,000 which would mature on December 31, 2024. The effective...
-
Below are six descriptions of internal control problems. In the space to the left of each description, enter the code letter of the internal control principle that is most related to the problem...
-
Describe horizontal analysis. Describe vertical analysis. What is each technique used for? How are the two methods similar? How are they different?
-
Suppose a company has a relatively high inventory turnover. What does the high inventory turnover indicate about the companys short-term liquidity?
-
How is the current ratio calculated? What is it used to measure? How is it interpreted?
-
What are financial budgets? List at least three financial budgets.
-
Name three components which can be measured with Google Analytics? Please provide how a company can use this data to make marketing/business decissions.
-
Maria Castigliani is head of the purchasing department of Ambrosiana Merceti, a medium-sized construction company. One morning she walked into the office and said, The main problem in this office is...
-
Many advocates of standard costing take the position that these costs are a proper basis for inventory costing for external reporting purposes. Accounting Research Bulletin No. 43, however, reflects...
-
On January 1, a materials analyst is asked to determine the number of units of Item AZ to be ordered for March delivery. The production schedule calls for 4,800 units of AZ for January operations,...
-
What is indicated by a factory overhead spending variance?
-
The potential problem with Yorktons approach to identifying ESG factors is the: A. promotion of uniform accounting standards. B. subjective assessment of ESG scores and rankings. C. inconsistent...
-
Strattons estimated conglomerate discount just prior to the announcement is: A. USD17 billion. B. USD0. C. USD17 billion. Elaine Lee is an analyst at an investment bank covering the energy sector....
-
The most relevant industry risk factors affecting Titian are: A. social. B. governance. C. environmental. Theresa Blass manages the Toptier Balanced Fund (the Fund) and recently hired John Yorkton, a...

Study smarter with the SolutionInn App