

Sales Year Month ($ millions) 2017 Jan 35630 2017 Feb 33972 2017 Mar 38622 2017 Apr...
Fantastic news! We've Found the answer you've been seeking!
Question:


Transcribed Image Text:
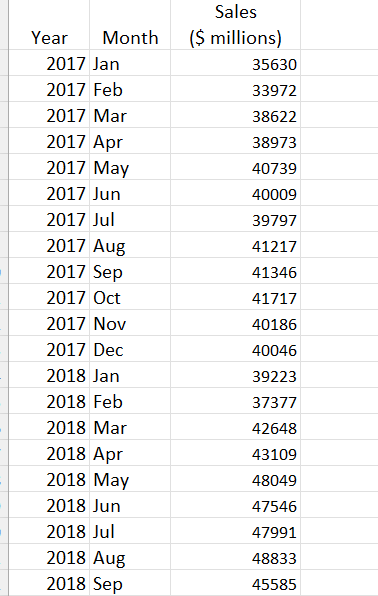
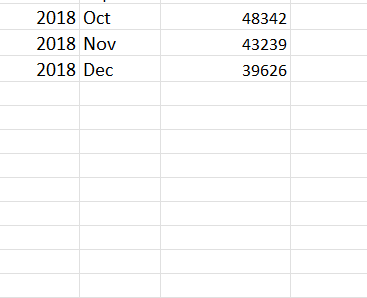
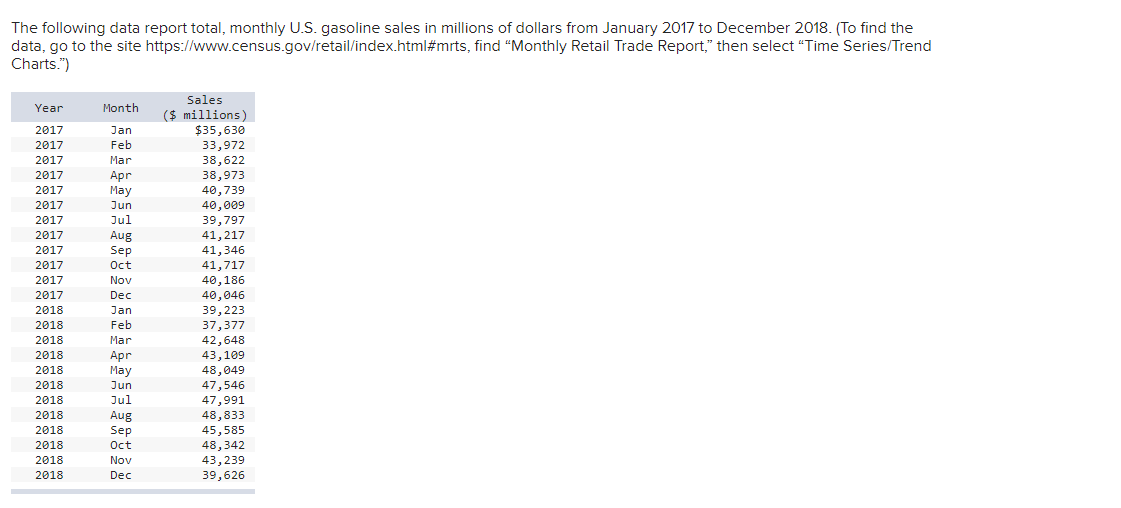
Sales Year Month ($ millions) 2017 Jan 35630 2017 Feb 33972 2017 Mar 38622 2017 Apr 38973 2017 May 40739 2017 Jun 40009 2017 Jul 39797 2017 Aug 41217 2017 Sep 41346 2017 Oct 41717 2017 Nov 40186 2017 Dec 40046 2018 Jan 39223 2018 Feb 37377 2018 Mar 42648 2018 Apr 43109 2018 May 48049 2018 Jun 47546 2018 Jul 47991 2018 Aug 48833 2018 Sep 45585 2018 Oct 48342 2018 Nov 43239 2018 Dec 39626 The following data report total, monthly U.S. gasoline sales in millions of dollars from January 2017 to December 2018. (To find the data, go to the site https://www.census.gov/retail/index.html#mrts, find "Monthly Retail Trade Report," then select "Time Series/Trend Charts.") Year Month Sales ($ millions) 2017 Jan $35,630 2017 Feb 33,972 2017 Mar 38,622 2017 Apr 38,973 2017 May 40,739 2017 Jun 40,009 2017 Jul 39,797 2017 Aug 41,217 2017 Sep 41,346 2017 Oct 41,717 2017 Nov 40,186 2017 Dec 40,046 2018 Jan 39,223 2018 Feb 37,377 2018 Mar 42,648 2018 Apr 43,109 2018 May 48,049 2018 Jun 47,546 2018 Jul 47,991 2018 Aug 48,833 2018 Sep 45,585 2018 Oct 48,342 2018 Nov 43,239 2018 Dec 39,626 d. Evaluate a seasonally adjusted trend forecasting model. What is the MAD? (Round your answers to 3 decimal places.) Period Month-Year Month Sales ($ Million) Trend Index Forecast Absolute Error 1 Jan-2017 1 35,630 2 Feb-2017 2 33,972 3 Mar-2017 3 38,622 4 Apr-2017 4 38,973 5 May-2017 5 40,739 6 Jun-2017 6 40,009 7 Jul-2017 7 39,797 8 Aug-2017 8 41,217 9 Sep-2017 9 41,346 10 Oct-2017 10 41,717 11 Nov-2017 11 40,186 12 Dec-2017 12 40,046 13 Jan-2018 1 39,223 14 Feb-2018 2 37,377 15 Mar-2018 3 42,648 16 Apr-2018 4 43,109 17 May-2018 5 48,049 18 Jun-2018 6 47,546 19 Jul-2018 7 47,991 20 Aug-2018 8 48,833 21 Sep-2018 9 45,585 22 Oct-2018 10 48,342 23 Nov-2018 11 43,239 24 Dec-2018 12 39,626 MAD= e. What are the monthly indexes? (Round your answers to 3 decimal places.) Month 1 Index 2 3 4 5 6 7 8 9 10 11 12 f. Forecast sales for January, February, March, and April of 2019. (Round your answers to 2 decimal places.) Forecasted Slaes Period 25 Sales Period 26 Sales Period 27 Sales Period 28 Sales million million million million Sales Year Month ($ millions) 2017 Jan 35630 2017 Feb 33972 2017 Mar 38622 2017 Apr 38973 2017 May 40739 2017 Jun 40009 2017 Jul 39797 2017 Aug 41217 2017 Sep 41346 2017 Oct 41717 2017 Nov 40186 2017 Dec 40046 2018 Jan 39223 2018 Feb 37377 2018 Mar 42648 2018 Apr 43109 2018 May 48049 2018 Jun 47546 2018 Jul 47991 2018 Aug 48833 2018 Sep 45585 2018 Oct 48342 2018 Nov 43239 2018 Dec 39626 The following data report total, monthly U.S. gasoline sales in millions of dollars from January 2017 to December 2018. (To find the data, go to the site https://www.census.gov/retail/index.html#mrts, find "Monthly Retail Trade Report," then select "Time Series/Trend Charts.") Year Month Sales ($ millions) 2017 Jan $35,630 2017 Feb 33,972 2017 Mar 38,622 2017 Apr 38,973 2017 May 40,739 2017 Jun 40,009 2017 Jul 39,797 2017 Aug 41,217 2017 Sep 41,346 2017 Oct 41,717 2017 Nov 40,186 2017 Dec 40,046 2018 Jan 39,223 2018 Feb 37,377 2018 Mar 42,648 2018 Apr 43,109 2018 May 48,049 2018 Jun 47,546 2018 Jul 47,991 2018 Aug 48,833 2018 Sep 45,585 2018 Oct 48,342 2018 Nov 43,239 2018 Dec 39,626 d. Evaluate a seasonally adjusted trend forecasting model. What is the MAD? (Round your answers to 3 decimal places.) Period Month-Year Month Sales ($ Million) Trend Index Forecast Absolute Error 1 Jan-2017 1 35,630 2 Feb-2017 2 33,972 3 Mar-2017 3 38,622 4 Apr-2017 4 38,973 5 May-2017 5 40,739 6 Jun-2017 6 40,009 7 Jul-2017 7 39,797 8 Aug-2017 8 41,217 9 Sep-2017 9 41,346 10 Oct-2017 10 41,717 11 Nov-2017 11 40,186 12 Dec-2017 12 40,046 13 Jan-2018 1 39,223 14 Feb-2018 2 37,377 15 Mar-2018 3 42,648 16 Apr-2018 4 43,109 17 May-2018 5 48,049 18 Jun-2018 6 47,546 19 Jul-2018 7 47,991 20 Aug-2018 8 48,833 21 Sep-2018 9 45,585 22 Oct-2018 10 48,342 23 Nov-2018 11 43,239 24 Dec-2018 12 39,626 MAD= e. What are the monthly indexes? (Round your answers to 3 decimal places.) Month 1 Index 2 3 4 5 6 7 8 9 10 11 12 f. Forecast sales for January, February, March, and April of 2019. (Round your answers to 2 decimal places.) Forecasted Slaes Period 25 Sales Period 26 Sales Period 27 Sales Period 28 Sales million million million million
Expert Answer:

Posted Date:
Students also viewed these mathematics questions
-
In Problems 2738, the reduced row echelon form of a system of linear equations is given. Write the system of equations corresponding to the given matrix. Use x, y; or x, y, z; or x 1 , x 2 , x 3 , x...
-
Pryor Company prepared the following factory overhead report from its general ledger: Indirect labor .......... $ 250,000 Fringe benefits ........ 30,000 Supplies ............ 70,000 Depreciation...
-
Based on the information given, which sources of job satisfaction has Datotel addressed? What other sources might the company address, and how?
-
Explain what is meant by multinomial bound evaluation. What are the advantages and disadvantages of multinomial bound evaluation compared to combined attributes-variables evaluation ? When should it...
-
Bartlett Car Wash Co. is considering the purchase of a new facility. It would allow Bartlett to increase its net income by $53,000 per year. Other information about this proposed project follows:...
-
4 NORMAL AND INCLINED SURFACES GIVEN: The front and top views of an object. REQUIRED: Draw the right side view and complete the bottom half as instructed. 1 2 3 5 6 7 8 9 10 10 11) 12 14 15 13 16 17...
-
A spherical, non-conducting shell of inner radius r 1 = 10 cm and outer radius r 2= 15 cm carries a total charge Q = 15 C distributed uniformly throughout the volume of the shell. What is the...
-
1. We dont employ people over 50 years old because they find it difficult to learn new skills. This statement was made by a training manager in a call centre. Comment on the statement using the...
-
Colcord Industries is replacing an old mixing machine. The old machine has been fully depreciated, but Colcord finds someone willing to buy it for $2,713. The new machine costs $35,000 and will be...
-
Expand and simplify: a) -3(x+2x-2) b) 4(x+2)+2x (5-1)
-
World Bridge Corporation manufactures a telecommunications device. During its first year of operations, the company started and completed 45 devices at a cost of $59,400 per unit. Of these, 43 were...
-
The Molding Division of Cotwold Company manufactures a plastic casing used by the Assembly Division. This casing is also sold to external customers for $ 4 3 per unit. Variable costs for the casing...
-
As the senior accountant at Technology on Demand (TOD), which manufactures flip phones, smartphones, notebooks, and smartwatches, you are responsible for assisting with employee related questions....
-
Why are stocks usually more risky than bonds?

Study smarter with the SolutionInn App