

Question: 12. Below is a correlations matrix that shows the pairwise correlation coefficients between each of three school districts in Yakima County and Washington State
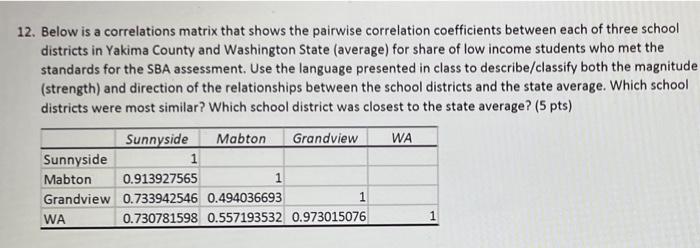
12. Below is a correlations matrix that shows the pairwise correlation coefficients between each of three school districts in Yakima County and Washington State (average) for share of low income students who met the standards for the SBA assessment. Use the language presented in class to describe/classify both the magnitude (strength) and direction of the relationships between the school districts and the state average. Which school districts were most similar? Which school district was closest to the state average? (5 pts) Sunnyside Mabton WA Sunnyside Mabton Grandview WA 1 1 Grandview 0.913927565 0.733942546 0.494036693 0.730781598 0.557193532 0.973015076 1 1
Step by Step Solution
3.41 Rating (157 Votes )
There are 3 Steps involved in it
The correlation matrix provided shows the pairwise correlation coefficients between schools in Yakim... View full answer

Get step-by-step solutions from verified subject matter experts