

Question: (same question two parts) Exercise 13-8 Analyzing and interpreting liquidity LO P3 [The following information applies to the questions displayed below.) Simon Company's year-end balance
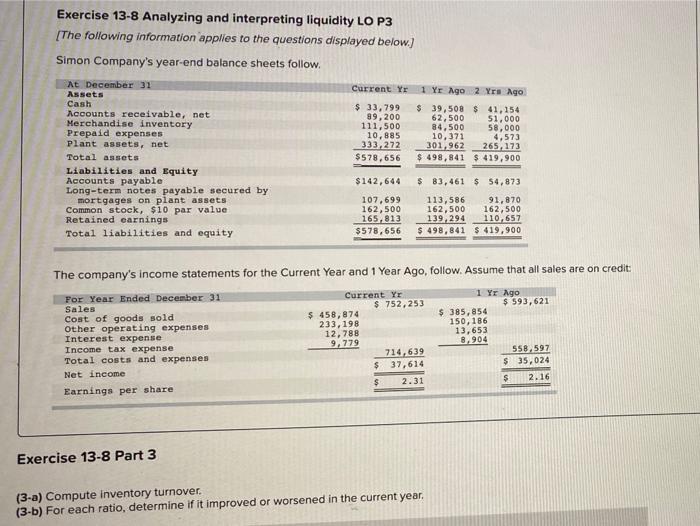
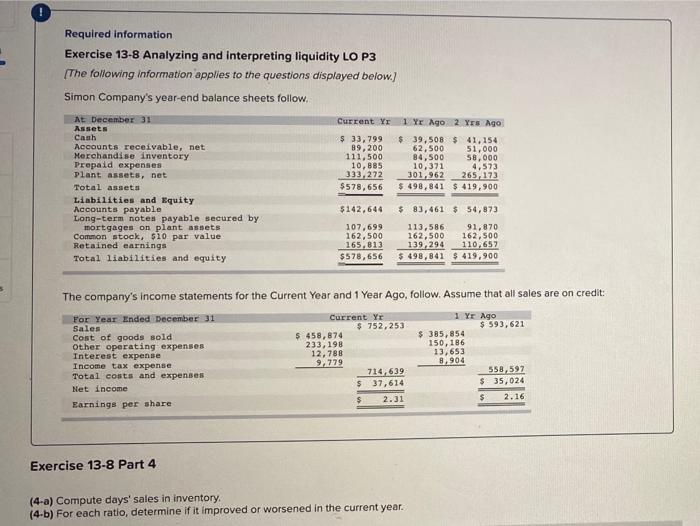
Exercise 13-8 Analyzing and interpreting liquidity LO P3 [The following information applies to the questions displayed below.) Simon Company's year-end balance sheets follow Current Yr At December 31 Assets Cash Accounts receivable, net Merchandise inventory Prepaid expenses Plant assets, net Total assets Liabilities and Equity Accounts payable Long-term notes payable secured by mortgages on plant assets Common stock, $10 par value Retained earnings Total liabilities and equity $ 33,799 99,200 111,500 10,885 333,272 $578,656 1 Yr Ago 2 Yrs Ago $ 39,508 $ 41,154 62,500 51,000 84,500 58,000 10,371 4,573 301,962 265, 173 $ 498,841 $ 419,900 $142,644 107,699 162,500 165.813 $578,656 $ 83,461 $ 54,873 113,586 91,870 162,500 162,500 139,294 110,657 $ 498,841 $ 419,900 The company's income statements for the Current Year and 1 Year Ago, follow. Assume that all sales are on credit: For Year Ended December 31 Sales Cont of goods sold Other operating expenses Interest expense Income tax expense Total costs and expenses Net income Earnings per share Current Yr $ 752, 253 $ 458,874 233,198 12,788 9,779 714,639 $ 37,614 $ 2.31 1 yr ago $ 593,621 $385,854 150,186 13,653 8,904 558,597 $ 35,024 S 2.16 Exercise 13-8 Part 3 (3-a) Compute inventory turnover. (3-b) For each ratio, determine if it improved or worsened in the current year, Required information Exercise 13-8 Analyzing and interpreting liquidity LO P3 (The following information applies to the questions displayed below.) Simon Company's year-end balance sheets follow, Current Yr At December 31 Assets Canh Accounts receivable, net Merchandise inventory Prepaid expenses Plant assets, net Total assets Liabilities and Equity Accounts payable Long-term notes payable secured by mortgages on plant assets Common stock, $10 par value Retained earnings Total liabilities and equity $ 33, 799 89,200 111,500 10,885 333272 $578,656 1 Yr Ago 2 YES Ago $ 39,508 5 41.154 62,500 51,000 84,500 58,000 10,371 4.573 301,962 265.173 $ 498,841 $ 419,900 $142,644 107,699 162,500 165,813 $578,656 $ 83,461 $ 54,873 113,586 91,870 162,500 162,500 139,294 110,657 $ 498,841 $ 419,900 The company's income statements for the Current Year and 1 Year Ago, follow. Assume that all sales are on credit: For Year Ended December 31 Current Yr 1 Yr Ago Sales $ 752, 253 $ 593,621 Cost of goods sold $ 458,874 $ 385,854 Other operating expenses 233, 198 150,186 Interest expense 12,788 13,653 Income tax expense 9,279 8,904 Total costs and expenses 714,639 558,597 Net Income $ 37,614 $ 35,024 Earnings per share $ 2.31 $ 2.16 Exercise 13-8 Part 4 (4-a) Compute days' sales in inventory (4.b) For each ratio, determine if it improved or worsened in the current year
Step by Step Solution
There are 3 Steps involved in it

Get step-by-step solutions from verified subject matter experts