

Question: Sample 1 Sample 2 Sample 3 Sample 4 12.03 11.88 11.54 11.63 12.03 11.33 11.61 11.70 12.06 11.72 11.51 11.60 12.19 11.92 11.74 11.83 12.12
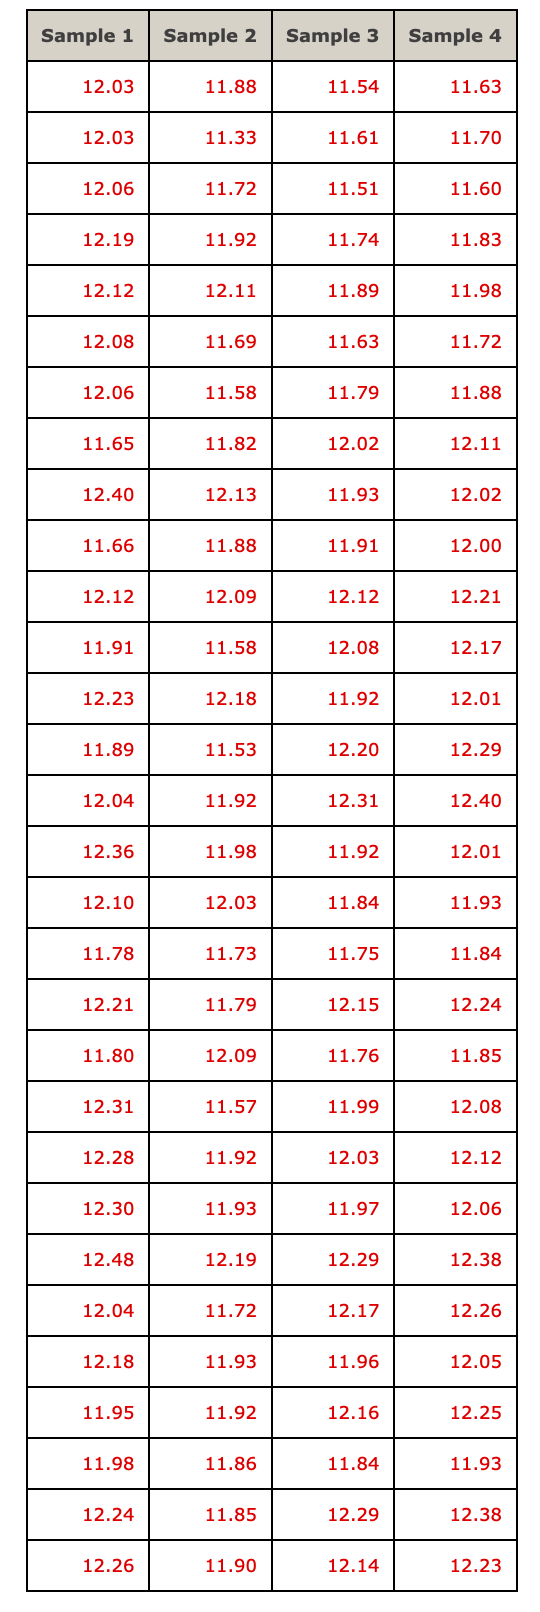
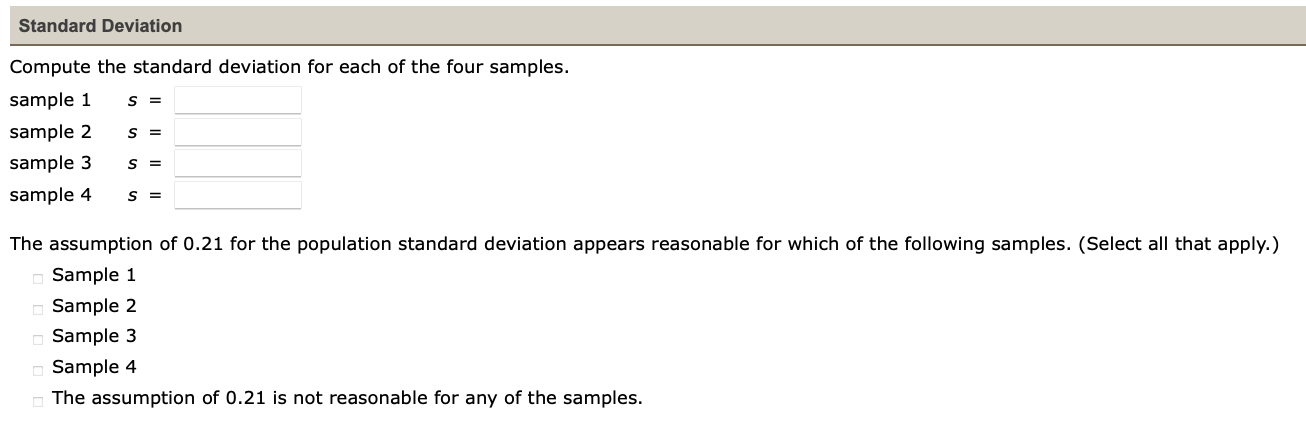
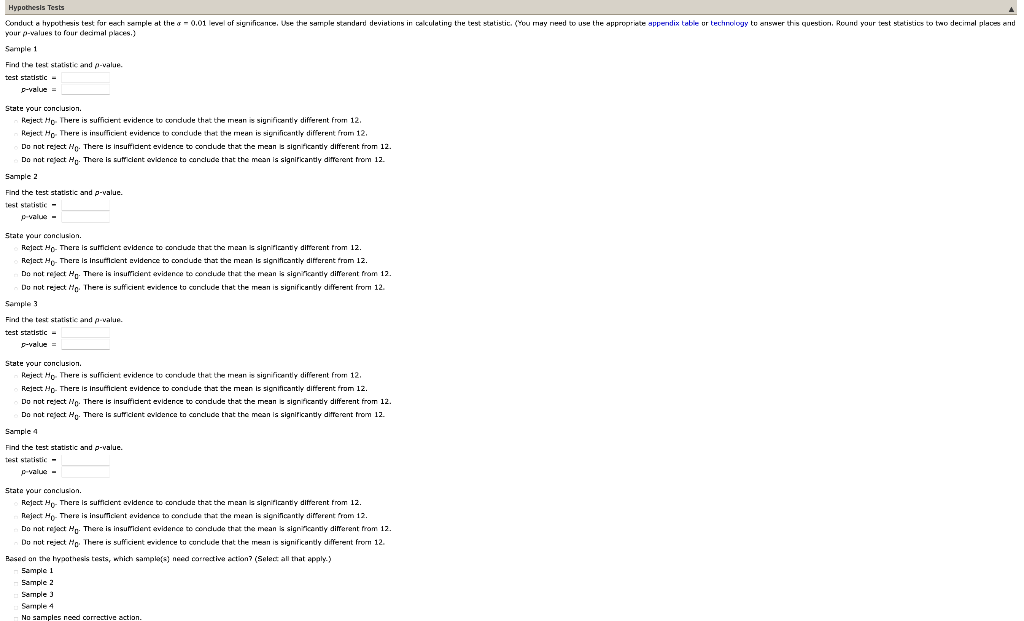
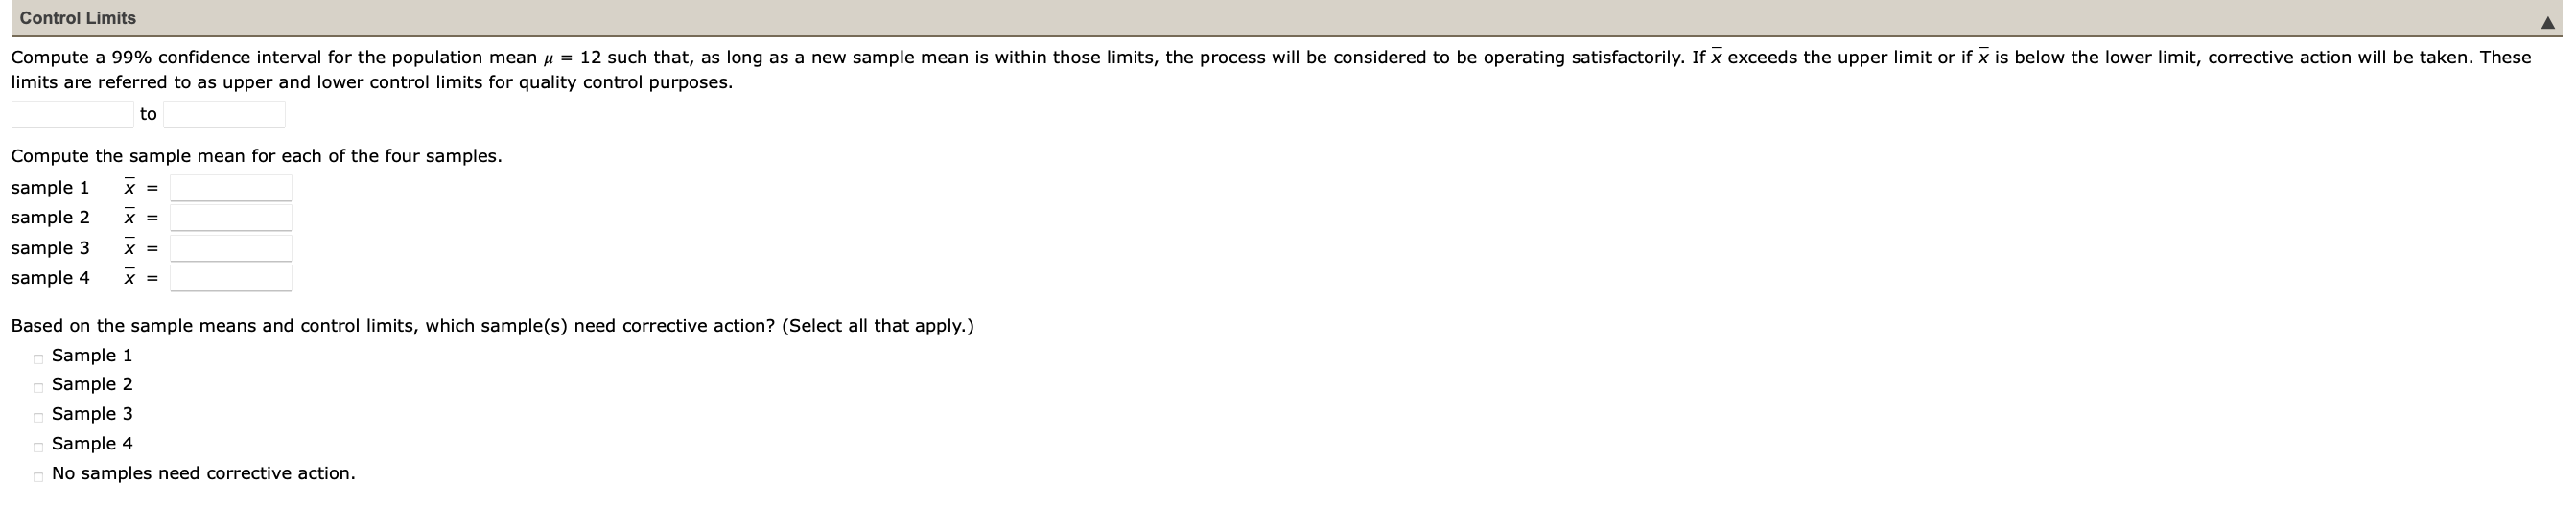

Sample 1 Sample 2 Sample 3 Sample 4 12.03 11.88 11.54 11.63 12.03 11.33 11.61 11.70 12.06 11.72 11.51 11.60 12.19 11.92 11.74 11.83 12.12 12.11 11.89 11.98 12.08 11.69 11.63 11.72 12.06 11.58 11.79 11.88 11.65 11.82 12.02 12.11 12.40 12.13 11.93 12.02 11.66 11.88 11.91 12.00 12.12 12.09 12.12 12.21 11.91 11.58 12.08 12.17 12.23 12.18 11.92 12.01 11.89 11.53 12.20 12.29 12.04 11.92 12.31 12.40 12.36 11.98 11.92 12.01 12.10 12.03 11.84 11.93 11.78 11.73 11.75 11.84 12.21 11.79 12.15 12.24 11.80 12.09 11.76 11.85 12.31 11.57 11.99 12.08 12.28 11.92 12.03 12.12 12.30 11.93 11.97 12.06 12.48 12.19 12.29 12.38 12.04 11.72 12.17 12.26 12.18 11.93 11.96 12.05 11.95 11.92 12.16 12.25 11.98 11.86 11.84 11.93 12.24 11.85 12.29 12.38 12.26 11.90 12.14 12.23 Standard Deviation Compute the standard deviation for each of the four samples. sample 1 S = sample 2 sample 3 sample 4 S = S = S = The assumption of 0.21 for the population standard deviation appears reasonable for which of the following samples. (Select all that apply.) Sample 1 Sample 2 Sample 3 Sample 4 The assumption of 0.21 is not reasonable for any of the samples. Hypothesis Tests Conduct a hypothesis test for each ample at the o- 0.01 level of significance. Use the sample standard deviations in calculating the test statistic. (You may need to use the appropriate appendix table ur technology to answer this question. Round your test statistics to two decimal places and your p-values to four decimal places.) Sample 1 Find the test statistic and value test statistic - D-value = State your concluson Reject Mo There is sufficient evidence to condude that the mean is significantly different from 12. Reject Mo There is insufficient evidence to condude that the mean is significantly different from 12. Do not reject Ho. There is insuffident evidence to condude that the mean is significantly different from 12. Do not reject Ho. There is sufficient evidence ta conclude that the mean is significantly different from 12. Sample 2 Find the test statistic and p-value. test statistic - p value - State your conclusion Refect Ho-There is sulfident evidence to condude that the mean is significantly different from 12. Refect - There is insufficient evidence to condude that the mean is significantly different from 12. Do not reject n. There is insufficient evidence to condude that the mean is significantly different from 12. Do not reject Mo There is sufficient evidence to cunclude that the mean is significantly different from 12. Sample 3 Find the test statistic and p-value test statistic - D-value State your concluson Reject Mo There is sufficient evidence to endude the the mean is significantly different from 12. Reject Me There is insufficient evidence to conclude that the mean is significantly different from 12. Do not reject No. There is insuffident evidence to condude that the means significantly different from 12. Do not reject Ho. There is sufficient evidence to conclude that the mean is significantly different from 12. Sample 4 Find the test statistic and p-value. test statistic - p-value - State your conclusion Relect There is suffident evidence to condude that the mean significantly different from 12. Reject Ho. There is insufficient evidence to condude that the mean is significantly different from 12. Do not reject Ho. There is insufficient evidence to condude that the mean is significantly different from 12. Du nut reject Ho. There is sufficient evidence to cunclude that the mean is significantly different from 12. Based on the hypothesis tests, which sample(s) need corrective action? (Select all that apaly.) Sample i Sample 2 Sample) Sample 4 No samples need corrective action Control Limits Compute a 99% confidence interval for the population mean y = 12 such that, as long as a new sample mean is within those limits, the process will be considered to be operating satisfactorily. If x exceeds the upper limit or if x is below the lower limit, corrective action will be taken. These limits are referred to as upper and lower control limits for quality control purposes. to Compute the sample mean for each of the four samples. sample 1 x = sample 2 x = sample 3 x = sample 4 x = Based on the sample means and control limits, which sample(s) need corrective action? (Select all that apply.) Sample 1 Sample 2 Sample 3 Sample 4 No samples need corrective action. Level of Significance Discuss the implications of changing the level of significance to a larger value. What mistake or error could increase if the level of significance is increased? Increasing the level of significance will cause the null hypothesis to be rejected (---Select--- often. Although this may mean quicker corrective action when the process is process ( ---Select--- ) operating satisfactorily. This would be an increase in the probability of a making a type ( ---Select--- A) error. ---Select--- control, it also means there will be a higher error probability of ---Select--- the process when the Sample 1 Sample 2 Sample 3 Sample 4 12.03 11.88 11.54 11.63 12.03 11.33 11.61 11.70 12.06 11.72 11.51 11.60 12.19 11.92 11.74 11.83 12.12 12.11 11.89 11.98 12.08 11.69 11.63 11.72 12.06 11.58 11.79 11.88 11.65 11.82 12.02 12.11 12.40 12.13 11.93 12.02 11.66 11.88 11.91 12.00 12.12 12.09 12.12 12.21 11.91 11.58 12.08 12.17 12.23 12.18 11.92 12.01 11.89 11.53 12.20 12.29 12.04 11.92 12.31 12.40 12.36 11.98 11.92 12.01 12.10 12.03 11.84 11.93 11.78 11.73 11.75 11.84 12.21 11.79 12.15 12.24 11.80 12.09 11.76 11.85 12.31 11.57 11.99 12.08 12.28 11.92 12.03 12.12 12.30 11.93 11.97 12.06 12.48 12.19 12.29 12.38 12.04 11.72 12.17 12.26 12.18 11.93 11.96 12.05 11.95 11.92 12.16 12.25 11.98 11.86 11.84 11.93 12.24 11.85 12.29 12.38 12.26 11.90 12.14 12.23 Standard Deviation Compute the standard deviation for each of the four samples. sample 1 S = sample 2 sample 3 sample 4 S = S = S = The assumption of 0.21 for the population standard deviation appears reasonable for which of the following samples. (Select all that apply.) Sample 1 Sample 2 Sample 3 Sample 4 The assumption of 0.21 is not reasonable for any of the samples. Hypothesis Tests Conduct a hypothesis test for each ample at the o- 0.01 level of significance. Use the sample standard deviations in calculating the test statistic. (You may need to use the appropriate appendix table ur technology to answer this question. Round your test statistics to two decimal places and your p-values to four decimal places.) Sample 1 Find the test statistic and value test statistic - D-value = State your concluson Reject Mo There is sufficient evidence to condude that the mean is significantly different from 12. Reject Mo There is insufficient evidence to condude that the mean is significantly different from 12. Do not reject Ho. There is insuffident evidence to condude that the mean is significantly different from 12. Do not reject Ho. There is sufficient evidence ta conclude that the mean is significantly different from 12. Sample 2 Find the test statistic and p-value. test statistic - p value - State your conclusion Refect Ho-There is sulfident evidence to condude that the mean is significantly different from 12. Refect - There is insufficient evidence to condude that the mean is significantly different from 12. Do not reject n. There is insufficient evidence to condude that the mean is significantly different from 12. Do not reject Mo There is sufficient evidence to cunclude that the mean is significantly different from 12. Sample 3 Find the test statistic and p-value test statistic - D-value State your concluson Reject Mo There is sufficient evidence to endude the the mean is significantly different from 12. Reject Me There is insufficient evidence to conclude that the mean is significantly different from 12. Do not reject No. There is insuffident evidence to condude that the means significantly different from 12. Do not reject Ho. There is sufficient evidence to conclude that the mean is significantly different from 12. Sample 4 Find the test statistic and p-value. test statistic - p-value - State your conclusion Relect There is suffident evidence to condude that the mean significantly different from 12. Reject Ho. There is insufficient evidence to condude that the mean is significantly different from 12. Do not reject Ho. There is insufficient evidence to condude that the mean is significantly different from 12. Du nut reject Ho. There is sufficient evidence to cunclude that the mean is significantly different from 12. Based on the hypothesis tests, which sample(s) need corrective action? (Select all that apaly.) Sample i Sample 2 Sample) Sample 4 No samples need corrective action Control Limits Compute a 99% confidence interval for the population mean y = 12 such that, as long as a new sample mean is within those limits, the process will be considered to be operating satisfactorily. If x exceeds the upper limit or if x is below the lower limit, corrective action will be taken. These limits are referred to as upper and lower control limits for quality control purposes. to Compute the sample mean for each of the four samples. sample 1 x = sample 2 x = sample 3 x = sample 4 x = Based on the sample means and control limits, which sample(s) need corrective action? (Select all that apply.) Sample 1 Sample 2 Sample 3 Sample 4 No samples need corrective action. Level of Significance Discuss the implications of changing the level of significance to a larger value. What mistake or error could increase if the level of significance is increased? Increasing the level of significance will cause the null hypothesis to be rejected (---Select--- often. Although this may mean quicker corrective action when the process is process ( ---Select--- ) operating satisfactorily. This would be an increase in the probability of a making a type ( ---Select--- A) error. ---Select--- control, it also means there will be a higher error probability of ---Select--- the process when the
Step by Step Solution
There are 3 Steps involved in it
1 Expert Approved Answer
Step: 1 Unlock

Question Has Been Solved by an Expert!
Get step-by-step solutions from verified subject matter experts
Step: 2 Unlock
Step: 3 Unlock