

Question: Sample 1 Sample 2 Sample 3 Sample 4 ProcessingTime Class 2 11.55 11.62 11.91 12.02 7.187198 Plant3 11.62 11.69 11.36 12.02 7.989601 Plant2 11.52 11.59
| Sample 1 | Sample 2 | Sample 3 | Sample 4 | ProcessingTime | Class 2 |
| 11.55 | 11.62 | 11.91 | 12.02 | 7.187198 | Plant3 |
| 11.62 | 11.69 | 11.36 | 12.02 | 7.989601 | Plant2 |
| 11.52 | 11.59 | 11.75 | 12.05 | 11.26615 | Plant1 |
| 11.75 | 11.82 | 11.95 | 12.18 | 6.528318 | Plant3 |
| 11.9 | 11.97 | 12.14 | 12.11 | 9.045739 | Plant1 |
| 11.64 | 11.71 | 11.72 | 12.07 | 6.983568 | Plant2 |
| 11.8 | 11.87 | 11.61 | 12.05 | 8.534597 | Plant2 |
| 12.03 | 12.1 | 11.85 | 11.64 | 9.70393 | Plant2 |
| 11.94 | 12.01 | 12.16 | 12.39 | 8.517197 | Plant1 |
| 11.92 | 11.99 | 11.91 | 11.65 | 8.1958 | Plant3 |
| 12.13 | 12.2 | 12.12 | 12.11 | 8.611301 | Plant3 |
| 12.09 | 12.16 | 11.61 | 11.9 | 9.535576 | Plant2 |
| 11.93 | 12 | 12.21 | 12.22 | 9.107972 | Plant3 |
| 12.21 | 12.28 | 11.56 | 11.88 | 6.308531 | Plant3 |
| 12.32 | 12.39 | 11.95 | 12.03 | 10.08485 | Plant1 |
| 11.93 | 12 | 12.01 | 12.35 | 8.547006 | Plant3 |
| 11.85 | 11.92 | 12.06 | 12.09 | 9.115515 | Plant3 |
| 11.76 | 11.83 | 11.76 | 11.77 | 9.736029 | Plant1 |
| 12.16 | 12.23 | 11.82 | 12.2 | 8.104529 | Plant3 |
| 11.77 | 11.84 | 12.12 | 11.79 | 8.747056 | Plant2 |
| 12 | 12.07 | 11.6 | 12.3 | 8.176643 | Plant1 |
| 12.04 | 12.11 | 11.95 | 12.27 | 10.37873 | Plant3 |
| 11.98 | 12.05 | 11.96 | 12.29 | 7.713026 | Plant1 |
| 12.3 | 12.37 | 12.22 | 12.47 | 9.967078 | Plant1 |
| 12.18 | 12.25 | 11.75 | 12.03 | 7.370988 | Plant1 |
| 11.97 | 12.04 | 11.96 | 12.17 | 7.503853 | Plant1 |
| 12.17 | 12.24 | 11.95 | 11.94 | 8.276488 | Plant2 |
| 11.85 | 11.92 | 11.89 | 11.97 | 8.72514 | Plant2 |
| 12.3 | 12.37 | 11.88 | 12.23 | 9.090859 | Plant1 |
| 12.15 | 12.22 | 11.93 | 12.25 | 9.0159 | Plant3 |
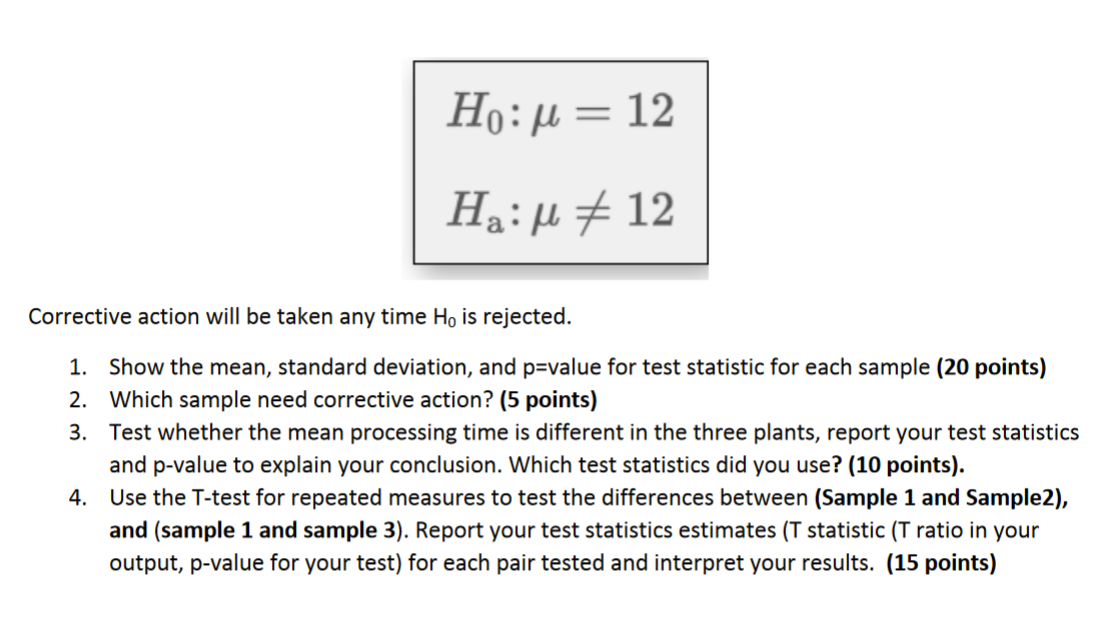
Case 2 Use the Quality dataset for this question Four random samples of size 30 were taken periodically to monitor the manufacturing process on an ongoing basis. By analyzing the four samples, you want to quickly learn whether the process was operating satisfactorily. When the process was not operating satisfactorily, corrective action could be taken to eliminate the problem. The design specification indicated the mean for the process should be 12. The hypothesis test suggested by Quality Associates follows: Corrective action will be taken any time H0 is rejected. 1. Show the mean, standard deviation, and p=value for test statistic for each sample (20 points) 2. Which sample need corrective action? (5 points) 3. Test whether the mean processing time is different in the three plants, report your test statistics and p-value to explain your conclusion. Which test statistics did you use? (10 points). 4. Use the T-test for repeated measures to test the differences between (Sample 1 and SampleZ), and (sample 1 and sample 3). Report your test statistics estimates (T statistic (T ratio in your output, p-value for your test) for each pair tested and interpret your results. (15 points)
Step by Step Solution
There are 3 Steps involved in it

Get step-by-step solutions from verified subject matter experts