

Question: Sample A Total Wt. = 106 g Sample B Total Wt. = 145 g Size Weight Retained % of Total Cumulative % Finer Than Weight
| Sample A Total Wt. = 106 g | Sample B Total Wt. = 145 g | |||||
| Size | Weight Retained | % of Total | Cumulative % Finer Than | Weight Retained | % of Total | Cumulative % Finer Than |
| 126 mm | 0 | 0 % | 100 % | 0 | 0 % | 100 % |
| 64 mm | 0 | 0 % | 100 % | 3.0 g | 2.1 % | 97.9 % |
| 38 mm | 0 | 0 % | 100 % | 4.3 g | 3.0 % | 97 % |
| 19 mm | 0 | 0 % | 100 % | 2.8 g | 1.9 % | 98 % |
| 8 mm | 0 | 0 % | 100 % | 7.4 g | 5.1 % | 94.9 % |
| 4 mm | 2.1 g | 2.0 % | 98 % | 4.5 g | 3.1 % | 96.9 % |
| 2 mm | 6.4 g | 6.0 % | 94 % | 7.2 g | 5.0 % | 95 % |
| 1 mm | 55.1 g | 52.0 % | 48 % | 8.7 g | 6.0 % | 94 % |
| 0.5 mm | 29.7 g | 28.0 % | 72 % | 17.4 g | 12.0 % | 88 % |
| 0.25 mm | 9.5 g | 9.0 % | 91 % | 16.2 g | 11.2 % | 88.8 % |
| 0.125 mm | 2.1 g | 2.0 % | 98 % | 16.0 g | 11.0 % | 89 % |
| 0.063 mm | 1.1 g | 1.0 % | 99 % | 23.2 g | 16.0 % | 84 % |
| 0.038 mm | 0 | 0 % | 100 % | 8.8 g | 6.1 % | 93.9 % |
| 0.019 mm | 0 | 0 % | 100 % | 11.6 g | 8.0 % | 92 % |
| 0.008 mm | 0 | 0 % | 100 % | 8.6 g | 5.9 % | 94.1 % |
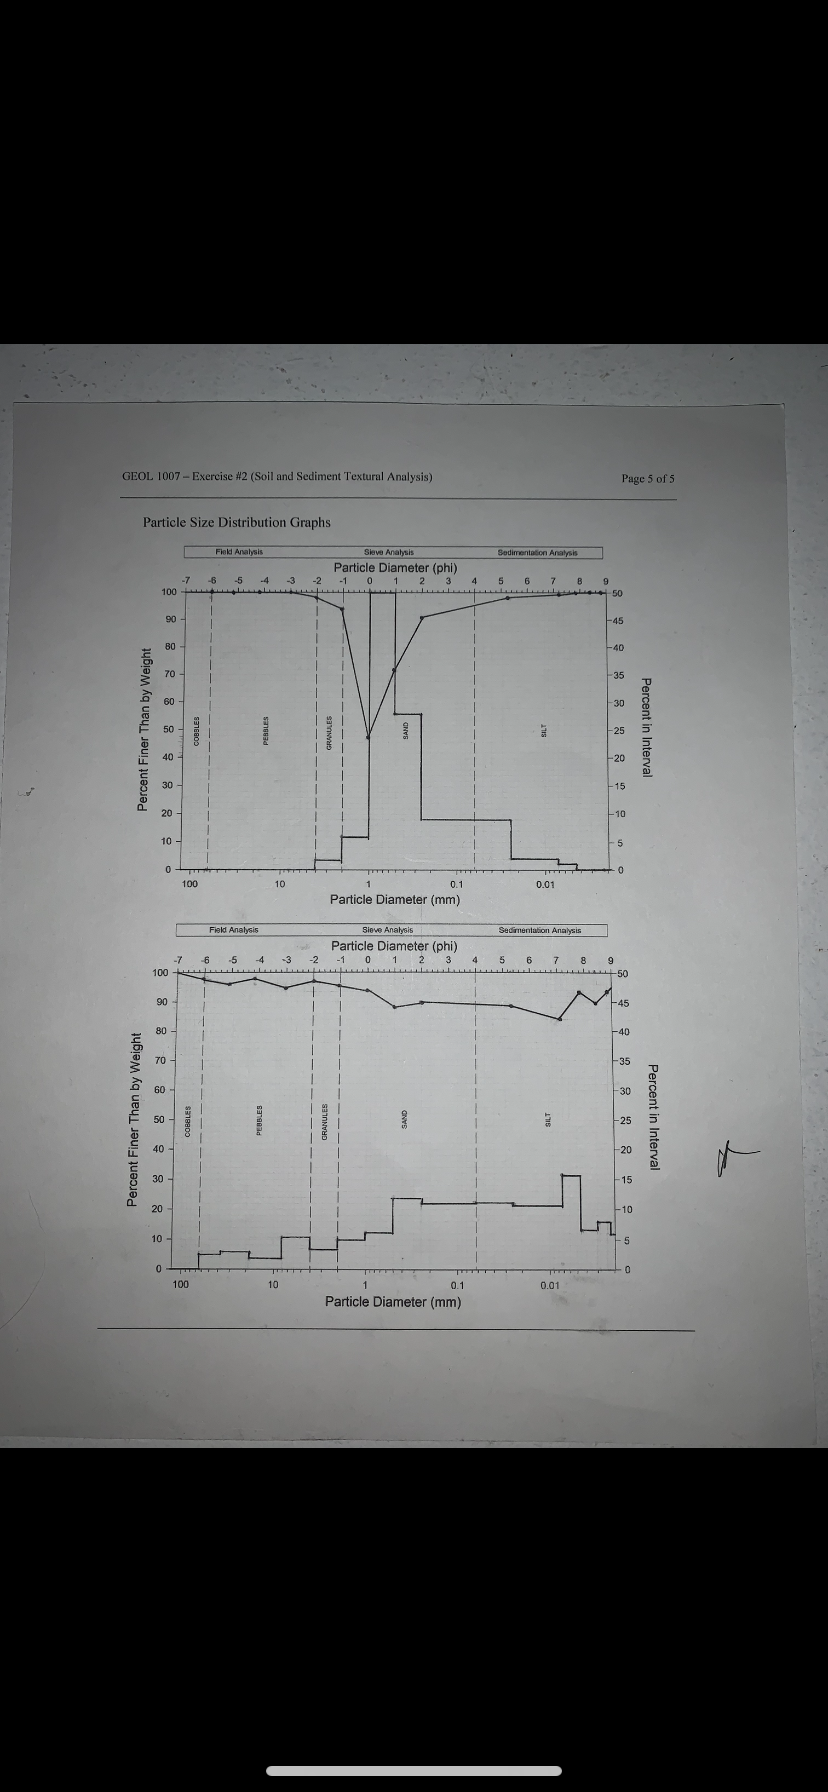
Examine the cumulative finer than curves for each sample. Note that these plots tell us how much (or what percentage) of the sample is finer than a particular size. We refer to these percent values as "percentiles". Since we are talking about particle diameter we use the shorthand D100, D84, D50 etc. to refer to the 100th, 84th and 50th percentiles and so on.
QUESTION: From the graphs, what is D95 value of each sample? How much of each sample is finer than this value? How much of each sample is coarser than this value? Why is it useful to know this value? BONUS: Why not use the D100 value?
\f
Step by Step Solution
There are 3 Steps involved in it
1 Expert Approved Answer
Step: 1 Unlock

Question Has Been Solved by an Expert!
Get step-by-step solutions from verified subject matter experts
Step: 2 Unlock
Step: 3 Unlock