

Question: Sample data (as shown below) was collected on the weight of 5 vehicles (in lbs.) and associated fuel efficiency in Miles Per Gallon (MPG). The
Sample data (as shown below) was collected on the weight of 5 vehicles (in lbs.) and associated fuel efficiency in Miles Per Gallon (MPG). The following is a partial Excel output which was reported.
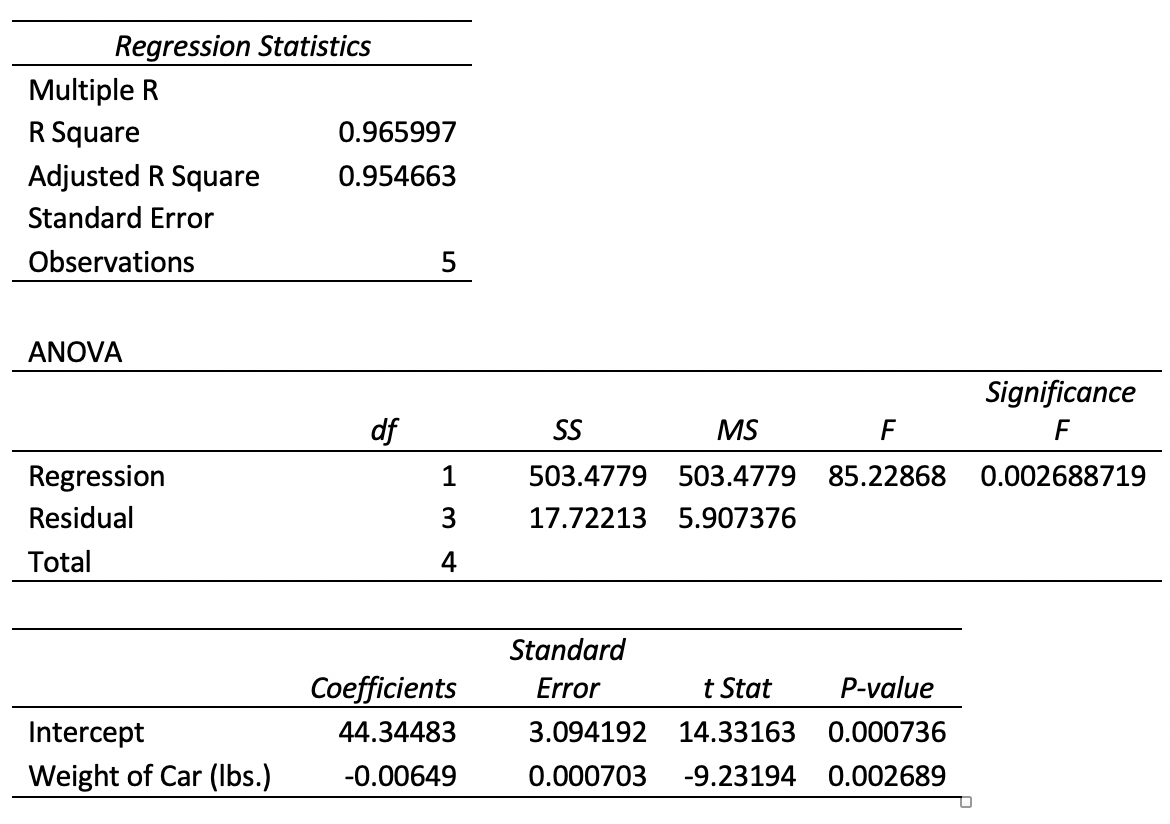
Regression Statistics Multiple R R Square 0. 965997 Adjusted R Square 0 . 954663 Standard Error Observations 5 ANOVA Significance of SS MS F F Regression 503. 4779 503. 4779 85. 22868 0. 002688719 W H Residual 17 . 72213 5. 907376 Total 4 Standard Coefficients Error + Stat P- value Intercept 44. 34 483 3. 094192 14. 33163 0. 000736 Weight of Car ( lbs . ) -0 . 00649 0. 000703 - 9 . 23194 0. 002689
Step by Step Solution
There are 3 Steps involved in it
1 Expert Approved Answer
Step: 1 Unlock

Question Has Been Solved by an Expert!
Get step-by-step solutions from verified subject matter experts
Step: 2 Unlock
Step: 3 Unlock