

Question: Sample Data: Is a hot dog a sandwich 30 people surveyed 21 'no' 9 'yes' For Part 2: Test against p=0.12 I will make the
Sample Data: Is a hot dog a sandwich
30 people surveyed
- 21 'no'
- 9 'yes'
For Part 2: Test against p=0.12
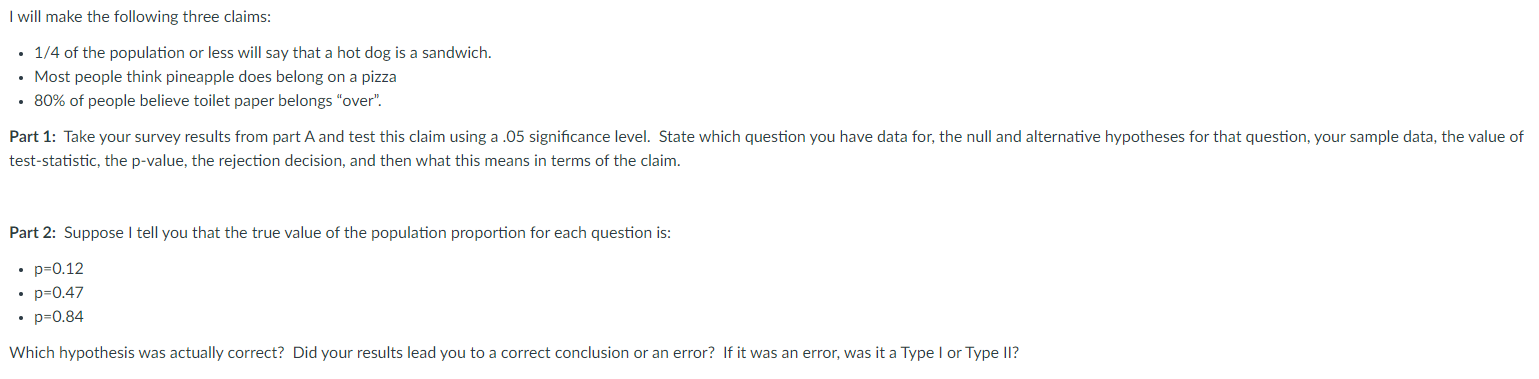
I will make the following three claims: - 1/4 of the population or less will say that a hot dog is a sandwich. - Most people think pineapple does belong on a pizza - 50% of people believe toilet paper belongs "over". Part 1: Take your survey results from partA and test this claim using a .05 signicance level. State which question you have data for, the null and alternative hypotheses for that question, your sample data, the value of test-statistic, the p-value, the rejection decision, and then what this means in terms of the claim. Part 2: Suppose I tell you that the true value of the population proportion for each question is: - p=0.12 - p=0.47 - p=0.84 Which hypothesis was actually correct? Did your results lead you to a correct conclusion or an error? If it was an error, was it a Type | or Type
Step by Step Solution
There are 3 Steps involved in it

Get step-by-step solutions from verified subject matter experts