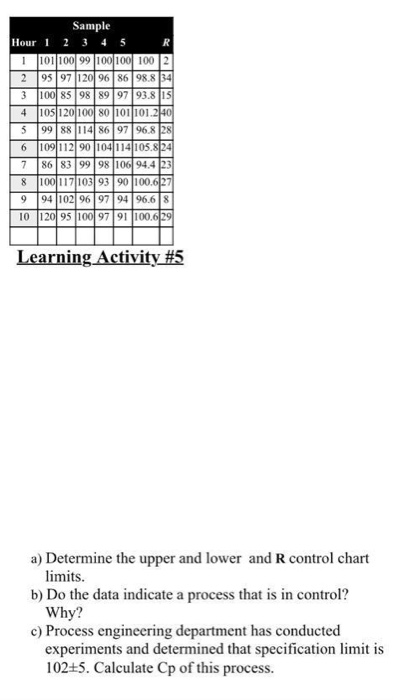
Question: Sample Hour 1 2 3 4 5 1101100 99 100 100 1002 2 95 97 120 96 86 98.8 34 3 100 85 98 89

Sample Hour 1 2 3 4 5 1101100 99 100 100 1002 2
Sample Hour 1 2 3 4 5 1101100 99 100 100 1002 2 95 97 120 96 86 98.8 34 3 100 85 98 89 9793.8 15 4 105 120100 80 101 101.2 40 5 99 88 114 86 97 96.8 28 6 109 112 90 104114105.824 786 83 99 98 10694,423 8 10011710393 90 100.627 994 102 96 97 94 96.6 8 10 120 95 100 9791 100.629 Learning Activity #5 a) Determine the upper and lower and R control chart limits. b) Do the data indicate a process that is in control? Why? c) Process engineering department has conducted experiments and determined that specification limit is 102+5. Calculate Cp of this process. Sample Hour 1 2 3 4 5 1101100 99 100 100 1002 2 95 97 120 96 86 98.8 34 3 100 85 98 89 97 93.8 15 4 105 120100 80 101 101.240 5 99 88 114 86 97 96.8 28 6 109 112 90 104114105.824 786 83 99 98 106 94.4 23 8 10011710393 90 100.627 994 102 96 97 94 96.68 10 120 95 10097 91 100.629 Learning Activity #5 a) Determine the upper and lower and R control chart limits. b) Do the data indicate a process that is in control? Why? c) Process engineering department has conducted experiments and determined that specification limit is 102+5. Calculate Cp of this process

Step by Step Solution

There are 3 Steps involved in it

1 Expert Approved Answer
Step: 1 Unlock blur-text-image
Question Has Been Solved by an Expert!

Get step-by-step solutions from verified subject matter experts

Step: 2 Unlock
Step: 3 Unlock

Students Have Also Explored These Related General Management Questions!