

Question: Sample Hour 1 3 4 5. x R 1 23 22 21 22 22 2. 17 19 42 18 8 3 12 7 9 7
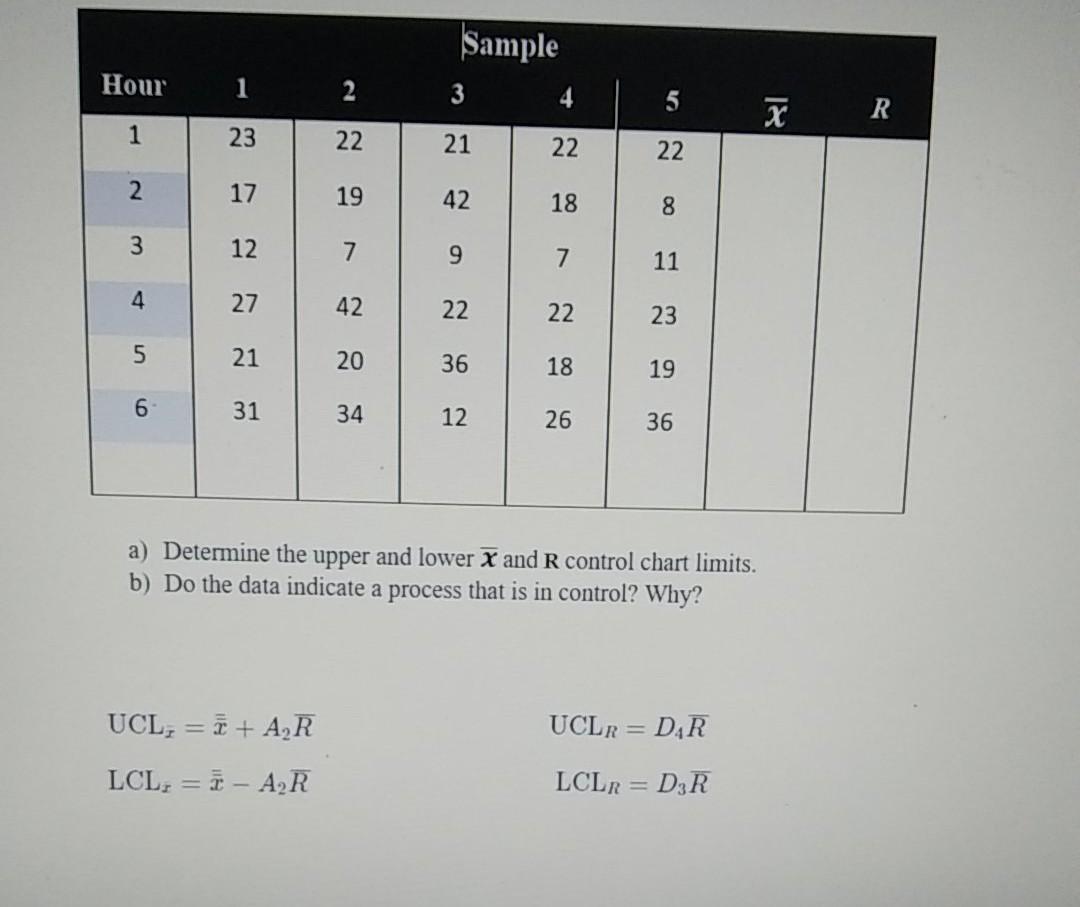
Sample Hour 1 3 4 5. x R 1 23 22 21 22 22 2. 17 19 42 18 8 3 12 7 9 7 11 4 27 42 22 22 23 5 21 20 36 18 19 6 31 34 12 26 36 a) Determine the upper and lower X and R control chart limits. b) Do the data indicate a process that is in control? Why? UCL, = i + A R UCLR = DAR LCL, = 2 - A,R LCLR = D3R
Step by Step Solution
There are 3 Steps involved in it
1 Expert Approved Answer
Step: 1 Unlock

Question Has Been Solved by an Expert!
Get step-by-step solutions from verified subject matter experts
Step: 2 Unlock
Step: 3 Unlock