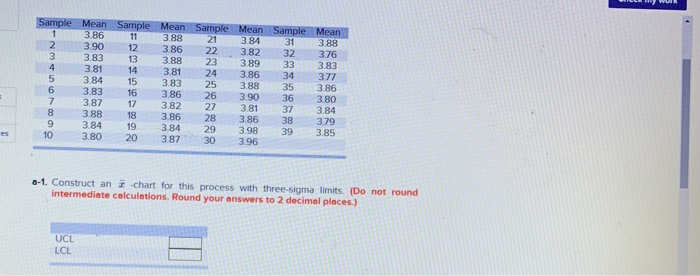
Question: Sample Mean Sample Mean Sample Mean Sample Mean 1 3 8611388 21 3.84 31 3.88 3.90 12 3.86 22 3.82 32 3.76 3 383 13

Sample Mean Sample Mean Sample Mean Sample Mean 1
Sample Mean Sample Mean Sample Mean Sample Mean 1 3 8611388 21 3.84 31 3.88 3.90 12 3.86 22 3.82 32 3.76 3 383 13 388 23 399 33 383 381 14 381 24 386 34 377 3.84 153 .83 25 388 35 386 3.83 16 386 26 390 36 3.80 387 17 3.82 27 381 37 3.84 3.88 18 3.86 28 386 38 3 84 19 384 29 398 39 3.85 3.80 20 387 30 3.96 379 0-1. Construct an chart for this process with three-sigma limits. (Do not round intermediate calculations. Round your answers to 2 decimal places.) UCL LCL 2 a. Determine upper and lower control limits that will include roughly 97 percent of the sample means when the process is 'in control. (Do not round intermediate calculations. Round z value to 2 decimal places. Round your answers to 4 decimal places.) points ter Upper control limits Lower control limits liter Problem 10-11 Specifications for the computer upgrades are 77 minutes and 81 minutes. Estimate the percentage of process output that can be expected to fall within the specifications. (Round your answer to 1 decimal place. Omit the "%" sign in your response.) 1 79.2 79.5 80.0 78.4 810 2 82.5 78.7 81.0 80.4 801 SAMPLE 3 4 79.6 78.9 796 79 3 80.6 79.7 80.3 79.4 80.8 80.6 5 80.2 79.6 80.4 80.8 78.8 6 79.7 80.6 80.4 80.0 811 Expected process output

Step by Step Solution

There are 3 Steps involved in it

1 Expert Approved Answer
Step: 1 Unlock blur-text-image
Question Has Been Solved by an Expert!

Get step-by-step solutions from verified subject matter experts

Step: 2 Unlock
Step: 3 Unlock

Students Have Also Explored These Related General Management Questions!