

Question: Sample Means and Probabilities Activity Purpose :To see the variation of outcomes when we select a random sample from the set of numbers 1 to
Sample Means and Probabilities Activity
Purpose:To see the variation of outcomes when we select a random sample from the set of numbers 1 to 100.To practice the module objectives "Describe the distribution of the sample mean for normal populations" and "Find and interpret the area under a normal curve"
Skills:Using technology to produce a set of random integers.Using technology to calculate normal probabilities.
Knowledge:This assignment will help you see the natural variation of means from a set.You'll also practice calculating normal probabilities, using your calculator.
Task:
Our population is the data set with values 1 to 100.The mean of the set is 50.5 and the SD is 29.01
1.Individually:Use the MATH-PRB-randInt command (1 to 100, pick 5) to get a random sample of 5 values from the set.In the table below, write down your sample and the mean of that sample.You'll do this 4 times
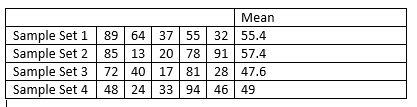
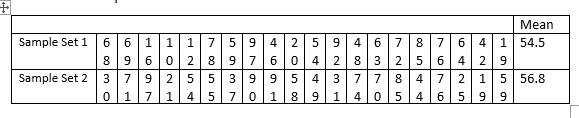
Mean Sample Set 1 89 64 37 55 32 55.4 Sample Set 2 85 13 20 78 91 57.4 Sample Set 3 72 40 17 81 28 47.6 Sample Set 4 48 24 33 94 46 49Mean A 1 54.5 4 W CI Sample Set 1 6 H IN WO 4 2 9 ON 4 2 5 2 2 6 4 7 1 5 56.8 3 9 2 LD LD Co un Sample Set 2 O W 4 O
Step by Step Solution
There are 3 Steps involved in it

Get step-by-step solutions from verified subject matter experts