

Question: Sample question Deadlock detection and graph reduction Figure: A Figure: B R1 R2 R3 R1 R2 R3 P1 P2 P3 P1 P2 P3 Fig A
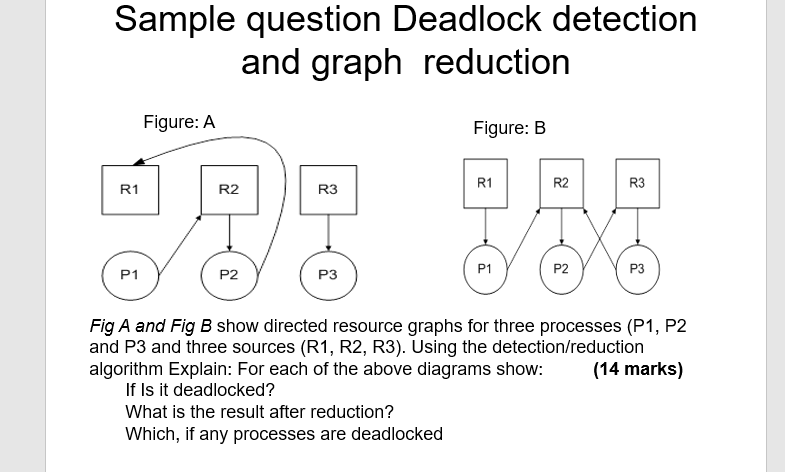
Sample question Deadlock detection and graph reduction Figure: A Figure: B R1 R2 R3 R1 R2 R3 P1 P2 P3 P1 P2 P3 Fig A and Fig B show directed resource graphs for three processes (P1, P2 and P3 and three sources (R1, R2, R3). Using the detection/reduction algorithm Explain: For each of the above diagrams show: (14 marks) If Is it deadlocked? What is the result after reduction? Which, if any processes are deadlocked
Step by Step Solution
There are 3 Steps involved in it
1 Expert Approved Answer
Step: 1 Unlock

Question Has Been Solved by an Expert!
Get step-by-step solutions from verified subject matter experts
Step: 2 Unlock
Step: 3 Unlock