

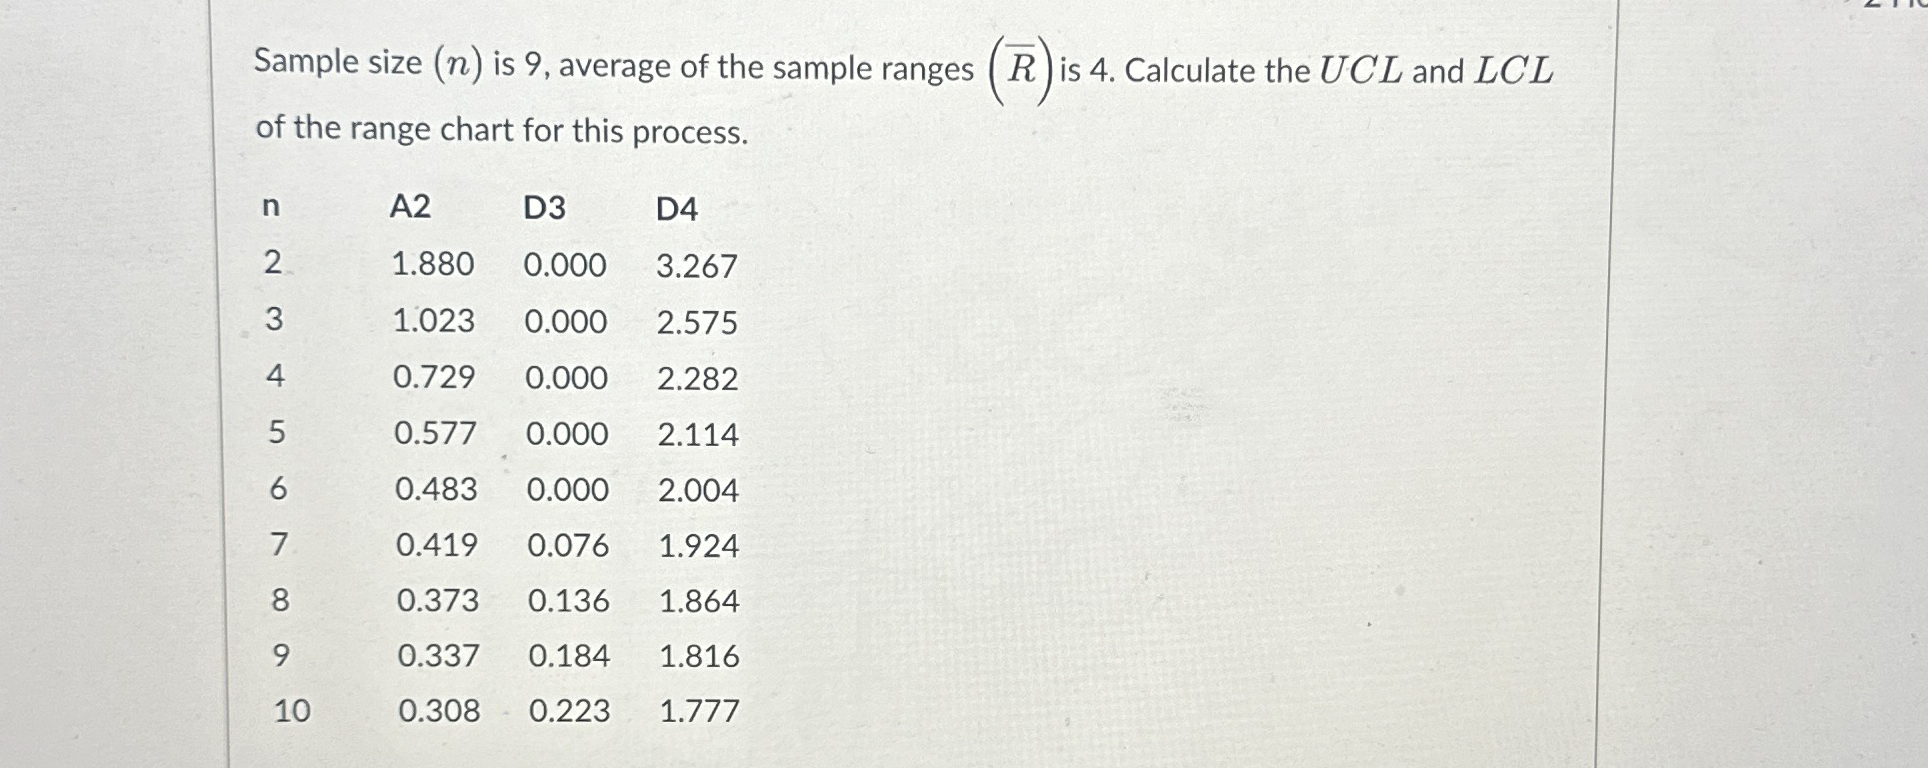
Question: Sample size ( n ) is 9 , average of the sample ranges ( ? b a r ( R ) ) is 4 .
Sample size is average of the sample ranges is Calculate the UCL and of the range chart for this process.
table
Step by Step Solution
There are 3 Steps involved in it
1 Expert Approved Answer
Step: 1 Unlock

Question Has Been Solved by an Expert!
Get step-by-step solutions from verified subject matter experts
Step: 2 Unlock
Step: 3 Unlock