

Question: Sample # Waiting time (Minute) 1 10.4 2 4.6 3 5.9 4 8.4 5 13.2 6 13.3 7 4.2 8 8.9 9 3.4 10 6.8
Sample # Waiting time (Minute) 1 10.4 2 4.6 3 5.9 4 8.4 5 13.2 6 13.3 7 4.2 8 8.9 9 3.4 10 6.8 11 7.5 12 12.7 13 10.9 14 7.1 15 6.9 16 8.5 17 5.8 18 7.6 19 9.4 20 6.2 21 9 22 11.9 23 6.1 24 11 25 5.4 26 9 27 10.6 28 9.2 29 9.3 30 8.1 31 11.9 32 12.2 33 10.1 34 12.5 35 8.3 36 7.1 37 7.5 38 6.7 39 5.6 40 4.1 41 11.1 42 10.4 43 13.6 44 5.2 45 10.6 46 6.7 47 9.9 48 8.5 49 8.3 50 12.3 51 5.1 52 7.3 53 11.5 54 7.9 55 8.3 56 6.1 57 7.1 58 10.2 59 11.9 60 7.8 61 10.3 62 9.9 63 9.4 64 12.7 65 16.2 66 7.8 67 12 68 8.4 69 6.5 70 2.5 71 7.3 72 8.8 73 5.1 74 4.1 75 8.9 76 10.7 77 9 78 5.5 79 0.1 80 14.3 81 12.5 82 6.1 83 6.2 84 9.2 85 9.9 86 5.6 87 11 88 10.4 89 13.4 90 11.5 91 11.1 92 5 93 6.5 94 9.3 95 10.1 96 4.9 97 12.2 98 2.5 99 6.8 100 9.9 101 5.4 102 10.1 103 8.3 104 6.8 105 10.1 106 3.7 107 15.1 108 7.1 109 5.6 110 5.5 111 8.4 112 5.3 113 5.7 114 9.5 115 10 116 6.2 117 8.4 118 8.8 119 7.3 120 9.5
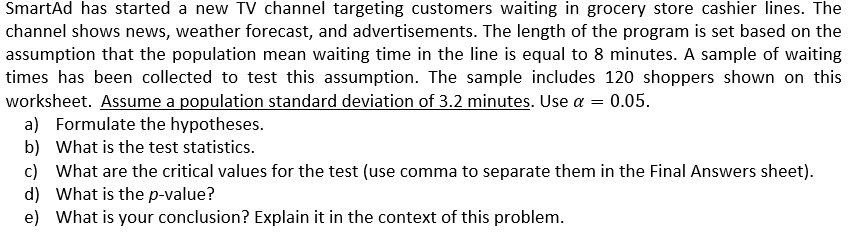 SmartAd has started a new TV channel targeting customers waiting in grocery store cashier lines. The channel shows news, weather forecast, and advertisements. The length of the program is set based on the assumption that the population mean waiting time in the line is equal to 8 minutes. A sample of waiting times has been collected to test this assumption. The sample includes 120 shoppers shown on this worksheet. Assume a population standard deviation of 3.2 minutes. Use (I = 0.05. a) Formulate the hypotheses. b) What is the test statistics. c) What are the critical values for the test [use comma to separate them in the Final Answers sheet]. d) What is the pvalue? e] What is your conclusion? Explain it in the context of this
Step by Step Solution
There are 3 Steps involved in it

Get step-by-step solutions from verified subject matter experts